The Great Furnace of China: How One Nation Controls the World's Copper Refining Pipe Visualization
Data Analysis
What This Visualization Shows
This data visualization displays "The Great Furnace of China: How One Nation Controls the World's Copper Refining Pipe" and provides a clear visual representation of the underlying data patterns and trends. The visualization focuses on Copper is a foundational material of the modern global economy, essential for everything from traditional construction to the rapidly expanding electric vehicle and artificial intelligence sectors. However, the most critical bottleneck in the copper supply chain is not the extraction of the raw ore, but rather the mid-stream processes of smelting and refining. The physical capacity to process raw earth into usable, refined metal ultimately dictates global supply dynamics, making this intermediate step strategically vital for technological advancement and economic stability.
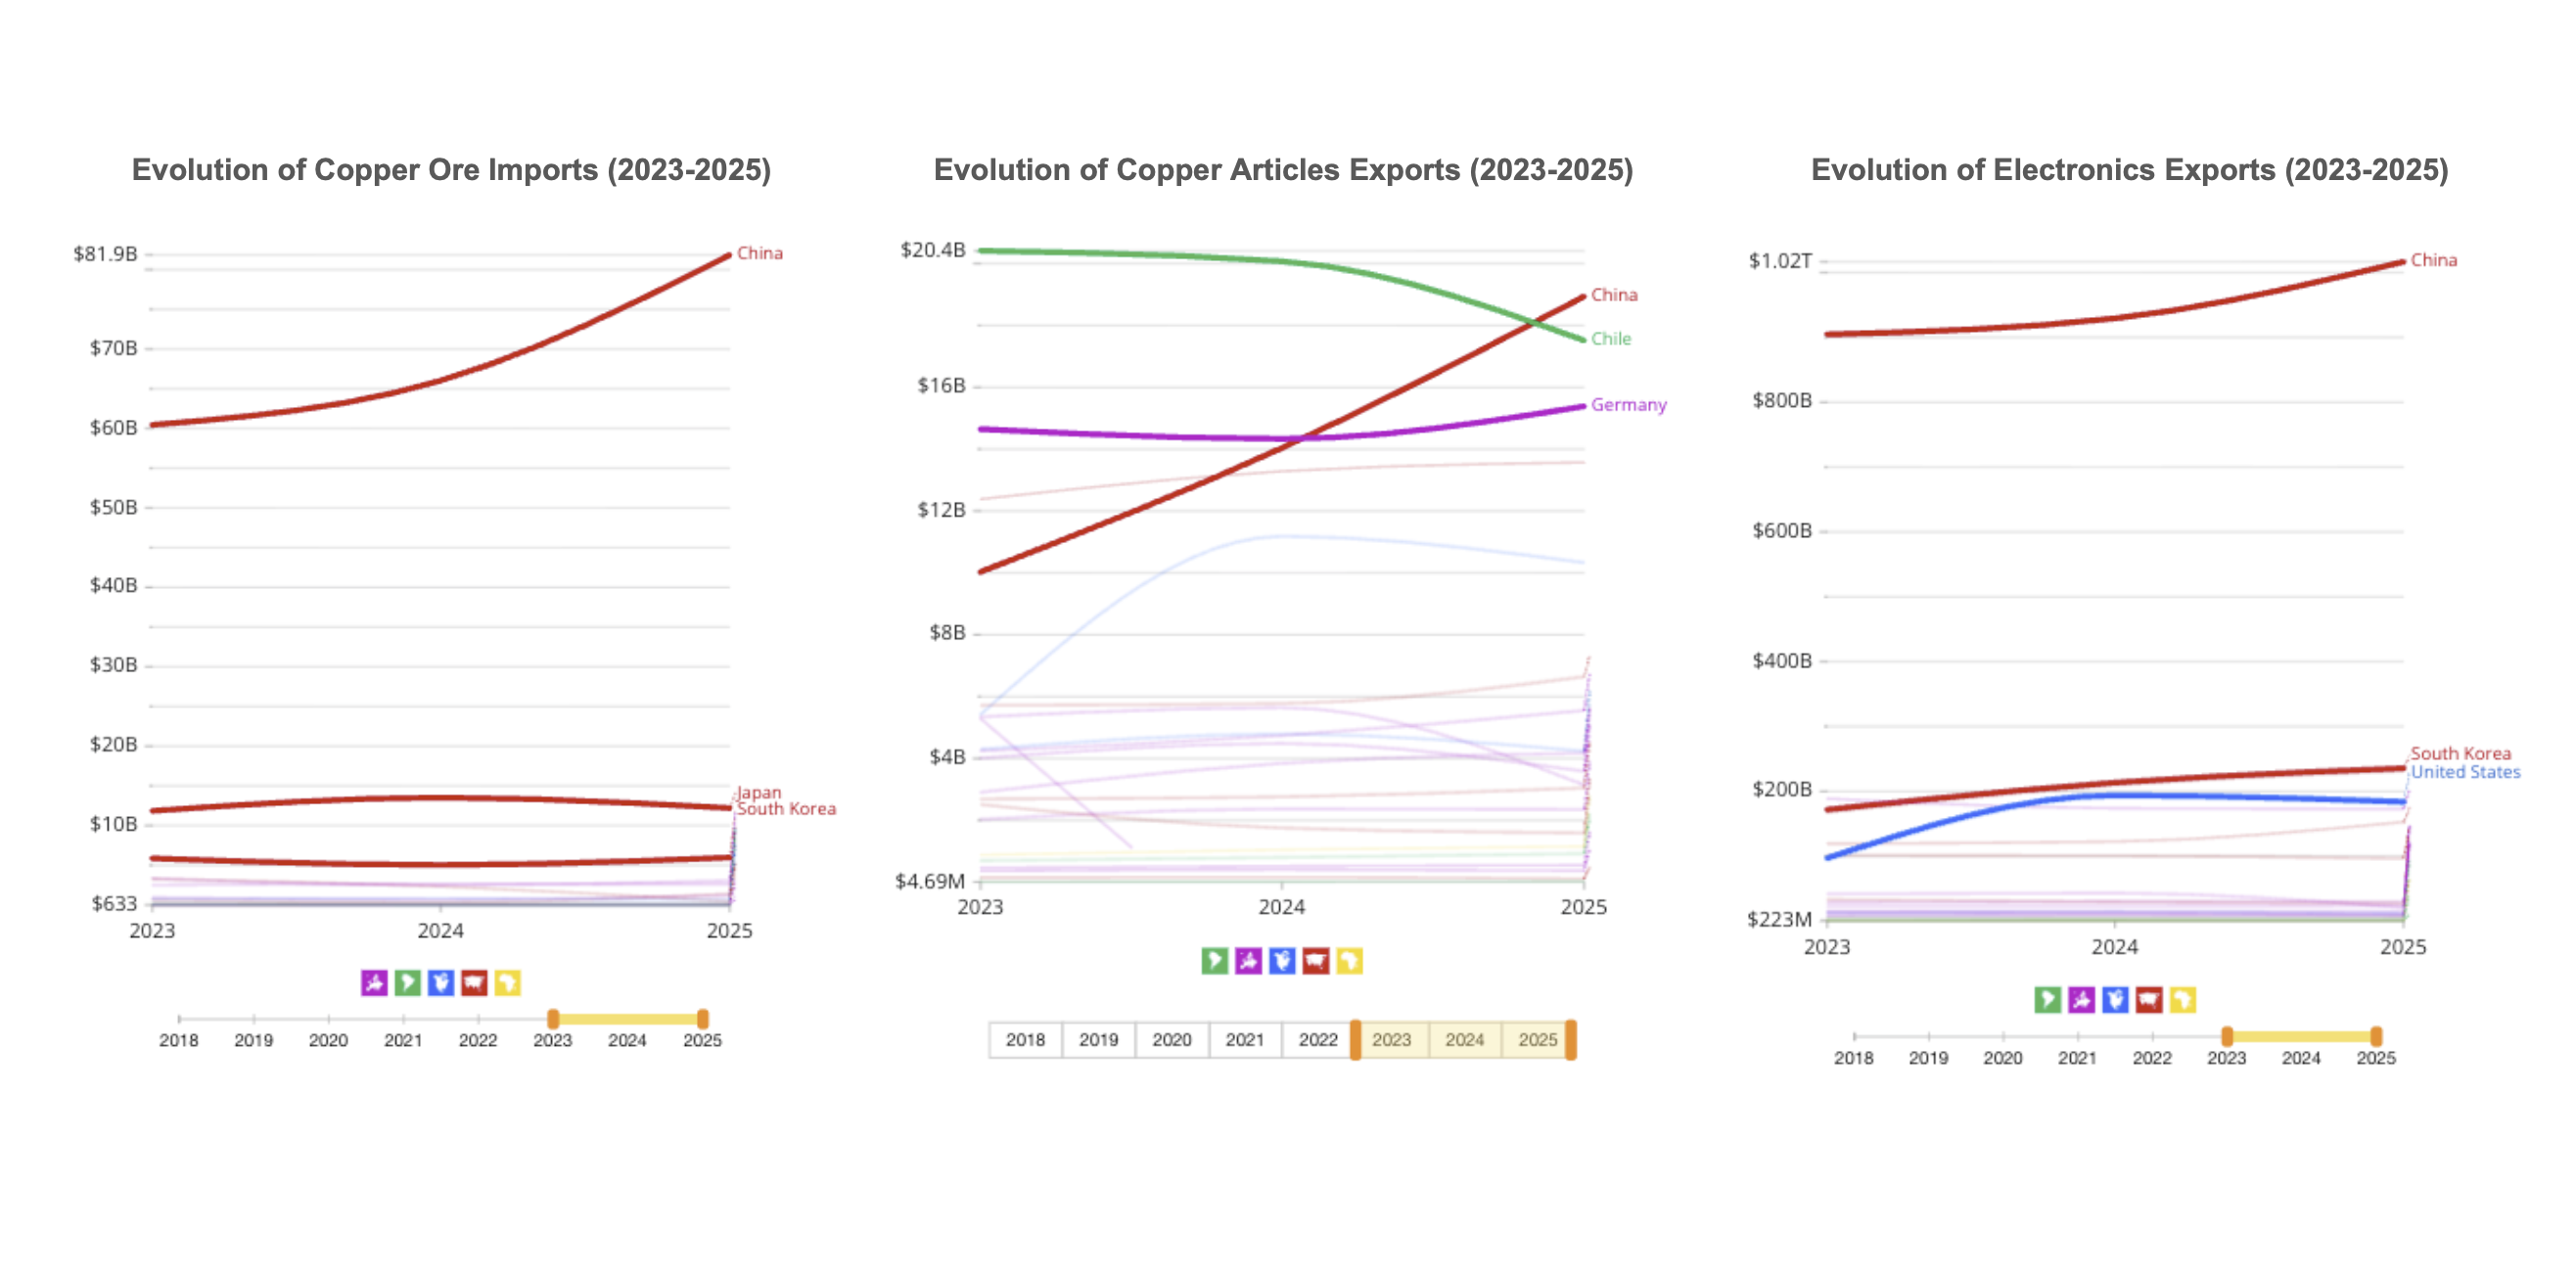
Recognizing the strategic importance of this bottleneck, China has spent decades building an extensive processing infrastructure. [Since 2000, the country has accounted for 75% of all global smelter capacity growth](https://www.woodmac.com/horizons/securing-copper-supply-china-energy-transition/#:~:text=Since%202000%2C%20China%20has%20accounted,some%2080%25%20of%20global%20additions.), establishing its status as the world's primary refining hub. Because its domestic mine supply only covers a fraction of its large-scale industrial requirements, China functions as a primary global importer of unrefined materials. To keep its network of furnaces operational, the country’s annual imports of raw copper ore reached approximately $81.9 billion in 2025. This volume significantly exceeds the next largest global importers, Japan and South Korea, which both recorded import values near the $10 billion to $12 billion mark. This disparity illustrates how untreated earth is drawn from across the globe to sustain a highly concentrated industrial sector.
The capacity of China's refining operations, [which alone account for over 50% of global refined copper production capacity](https://discoveryalert.com.au/chinas-strategic-copper-processing-control-2025/#:~:text=According%20to%20the%20International%20Copper,located%20within%20mainland%20China's%20borders.), allows the nation to maintain a leading position in the international market for semi-finished goods. Consequently, China exports substantial volumes of copper articles, such as pipes, tubes, and wires. By 2025, these mid-stream exports reached nearly $19 billion, allowing China to overtake major mining hubs like Chile and traditional industrial centers like Germany. With approximately half of the world's total fabrication capacity located within its borders, the country serves as the central supplier for mid-stream industrial components.
The ultimate advantage of controlling the copper smelting bottleneck is its downstream impact on high-tech manufacturing. Because China's domestic manufacturing sector has localized access to an abundant supply of refined copper, it holds a distinct competitive edge. Modern industries require substantial amounts of this highly conductive metal to build electric vehicles, solar panels, smartphones, and power grids. As a direct result of this localized material abundance, Chinese electronics and high-tech exports recorded approximately $1.02 trillion in 2025. By comparison, South Korea and the United States recorded roughly $200 billion each. This significant difference in export volume solidifies China’s leading position in advanced manufacturing.
Source: [https://oec.world/en/profile/country/chn](https://oec.world/en/profile/country/chn), which allows us to understand complex relationships and insights within the data through visual storytelling.
Deep Dive into the Topic
This data visualization represents a sophisticated analysis of complex information patterns that provide valuable insights into underlying trends and relationships. Data visualization serves as a bridge between raw numerical data and human understanding, transforming abstract statistics into comprehensible visual narratives.
The power of data visualization lies in its ability to reveal patterns, outliers, and correlations that might not be apparent in traditional tabular formats. Through careful selection of chart types, color schemes, and interactive elements, effective visualizations can communicate complex information quickly and accurately to diverse audiences.
Modern data visualization combines statistical analysis with design principles to create compelling visual stories. This interdisciplinary approach requires understanding both the underlying data and the cognitive processes involved in visual perception. The result is more effective communication of quantitative insights that can inform decision-making and drive positive change.
Data Analysis and Insights
The patterns revealed in this visualization demonstrate the importance of systematic data analysis in understanding complex phenomena. By examining different data segments, time periods, and categorical breakdowns, we can identify trends that inform strategic planning and decision-making processes.
Statistical analysis of this data reveals variations across different dimensions that provide insights into underlying drivers and relationships. These patterns help identify areas of opportunity, potential risks, and key performance indicators that can guide future actions and resource allocation.
The analytical approach used in this visualization enables comparison across different categories, time periods, or geographic regions, revealing insights that support evidence-based decision-making. This type of analysis is essential for organizations seeking to optimize performance and understand complex market dynamics.
Significance and Applications
This data visualization has important implications for understanding trends and patterns that affect decision-making across multiple sectors. The insights derived from this analysis can inform policy development, business strategy, resource allocation, and operational improvements.
For analysts, researchers, and decision-makers, this type of data visualization provides essential insights for strategic planning and performance optimization. Whether addressing operational challenges, market analysis, or policy development, understanding data patterns helps create more effective strategies and solutions.
The broader significance lies in how this information contributes to our understanding of complex systems and relationships. This knowledge helps predict future trends, identify potential challenges, and develop more informed approaches to problem-solving and opportunity identification.
Comments
Loading comments...
Leave a Comment
About the Author

Alex Cartwright
Senior Data Visualization Expert
Alex Cartwright is a renowned data visualization specialist and infographic designer with over 15 years of experience in...