data-visualization Maps
1006 geographic visualizations tagged with "data-visualization"
![I analyzed 12 years of iMessages to compare my texting habits with my girlfirend, mom, dad, and the boys [OC] Visualization I analyzed 12 years of iMessages to compare my texting habits with my girlfirend, mom, dad, and the boys [OC] Visualization](/api/images/reddit-maps/1qb234f_1768442402099.jpg)
I analyzed 12 years of iMessages to compare my texting habits with my girlfirend, mom, dad, and the boys [OC] Visualization
This data visualization displays "I analyzed 12 years of iMessages to compare my texting habits with my girlfirend, mom,...
![A Quarter Century of Television [OC] Visualization A Quarter Century of Television [OC] Visualization](/api/images/reddit-maps/1qaq7kz_1768442402792.jpg)
A Quarter Century of Television [OC] Visualization
This data visualization displays "A Quarter Century of Television [OC]" and provides a clear visual representation of th...
![[OC] The land footprint of food Visualization [OC] The land footprint of food Visualization](/api/images/reddit-maps/1qciikf_1768413601616.jpg)
[OC] The land footprint of food Visualization
This data visualization displays "[OC] The land footprint of food" and provides a clear visual representation of the und...
![[OC] The gender balance in different religions Visualization [OC] The gender balance in different religions Visualization](/api/images/reddit-maps/1qc5d4l_1768413602834.jpg)
[OC] The gender balance in different religions Visualization
This data visualization displays "[OC] The gender balance in different religions" and provides a clear visual representa...
![[OC] NATO coalition personnel fatalities in Afghanistan Visualization [OC] NATO coalition personnel fatalities in Afghanistan Visualization](/api/images/reddit-maps/1qkmypn_1769169601011.jpg)
[OC] NATO coalition personnel fatalities in Afghanistan Visualization
This data visualization displays "[OC] NATO coalition personnel fatalities in Afghanistan" and provides a clear visual r...
![[OC] Coalition Fatalities in Afghanistan (Death per Million Population, 2001-2021) Data Visualization [OC] Coalition Fatalities in Afghanistan (Death per Million Population, 2001-2021) Data Visualization](/api/images/reddit-maps/1qr7gqz_1769810401286.jpg)
[OC] Coalition Fatalities in Afghanistan (Death per Million Population, 2001-2021) Data Visualization
This data visualization displays "[OC] Coalition Fatalities in Afghanistan (Death per Million Population, 2001-2021)" an...
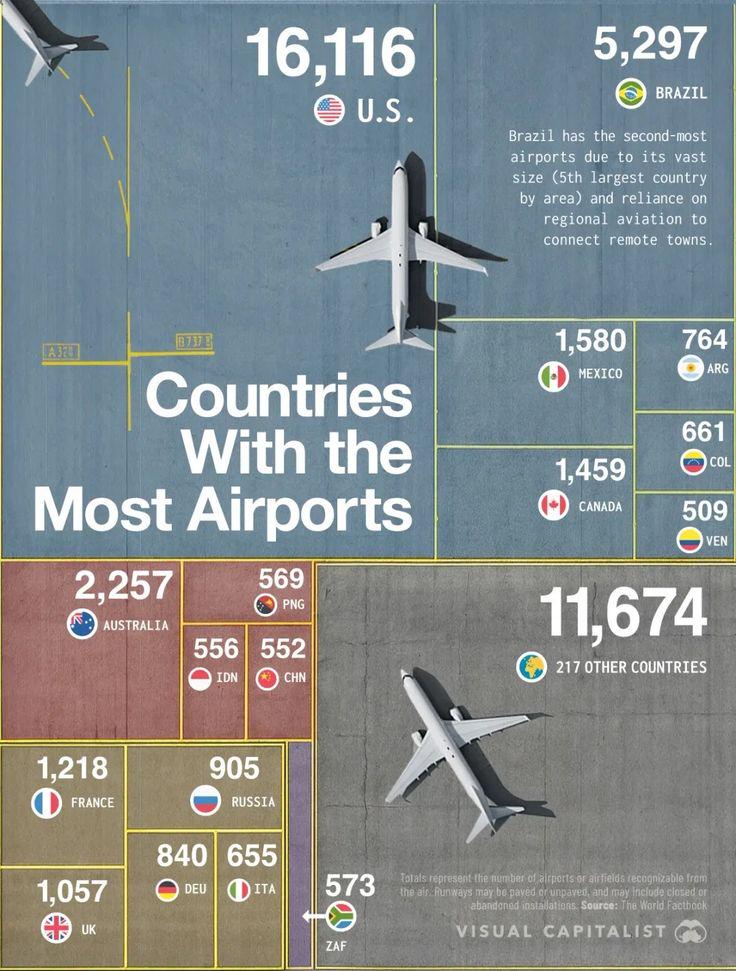
Countries With the Most Airports Visualization
This data visualization displays "Countries With the Most Airports" and provides a clear visual representation of the un...
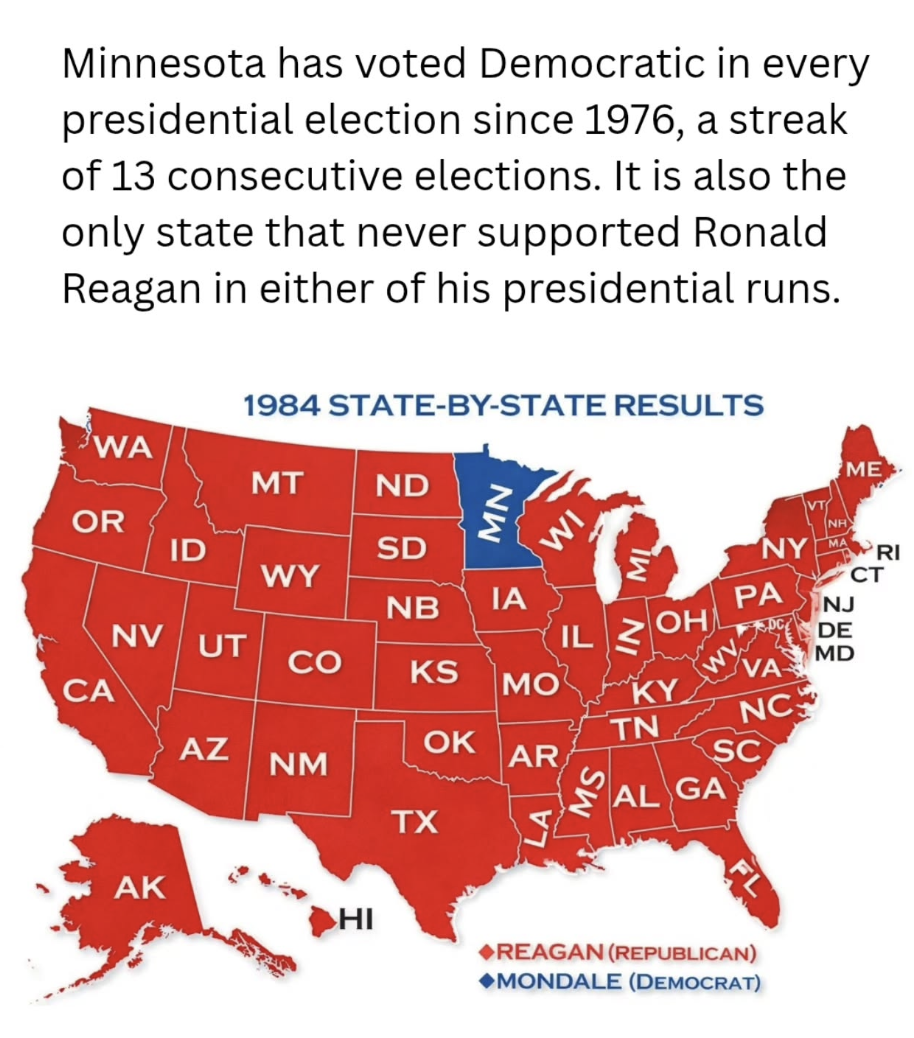
Minnesota has voted for the Democratic nominee in every presidential election since 1976. Visualization
This data visualization displays "Minnesota has voted for the Democratic nominee in every presidential election since 19...
![[OC] Presidents and VPs Mentioned by Trump Visualization [OC] Presidents and VPs Mentioned by Trump Visualization](/api/images/reddit-maps/1qk77w5_1769126401114.jpg)
[OC] Presidents and VPs Mentioned by Trump Visualization
This data visualization displays "[OC] Presidents and VPs Mentioned by Trump" and provides a clear visual representation...
![[OC] Interactive 3D Climate Spiral Visualization [OC] Interactive 3D Climate Spiral Visualization](/api/images/reddit-maps/1qh9wl3_1768860001772.jpg)
[OC] Interactive 3D Climate Spiral Visualization
This data visualization displays "[OC] Interactive 3D Climate Spiral" and provides a clear visual representation of the ...
![[OC] Does the news reflect what we die from? Visualization [OC] Does the news reflect what we die from? Visualization](/api/images/reddit-maps/1qq4m2v_1769695201033.jpg)
[OC] Does the news reflect what we die from? Visualization
This data visualization displays "[OC] Does the news reflect what we die from?" and provides a clear visual representati...
![[OC] The Most Expensive TV Shows Of All-Time Visualization [OC] The Most Expensive TV Shows Of All-Time Visualization](/api/images/reddit-maps/1qu070a_1770055201184.jpg)
[OC] The Most Expensive TV Shows Of All-Time Visualization
This data visualization displays "[OC] The Most Expensive TV Shows Of All-Time" and provides a clear visual representati...
![[OC] Coalition Casualties in Afghanistan (2001-2021) Visualization [OC] Coalition Casualties in Afghanistan (2001-2021) Visualization](/api/images/reddit-maps/1qpn916_1769644801325.jpg)
[OC] Coalition Casualties in Afghanistan (2001-2021) Visualization
This data visualization displays "[OC] Coalition Casualties in Afghanistan (2001-2021)" and provides a clear visual repr...
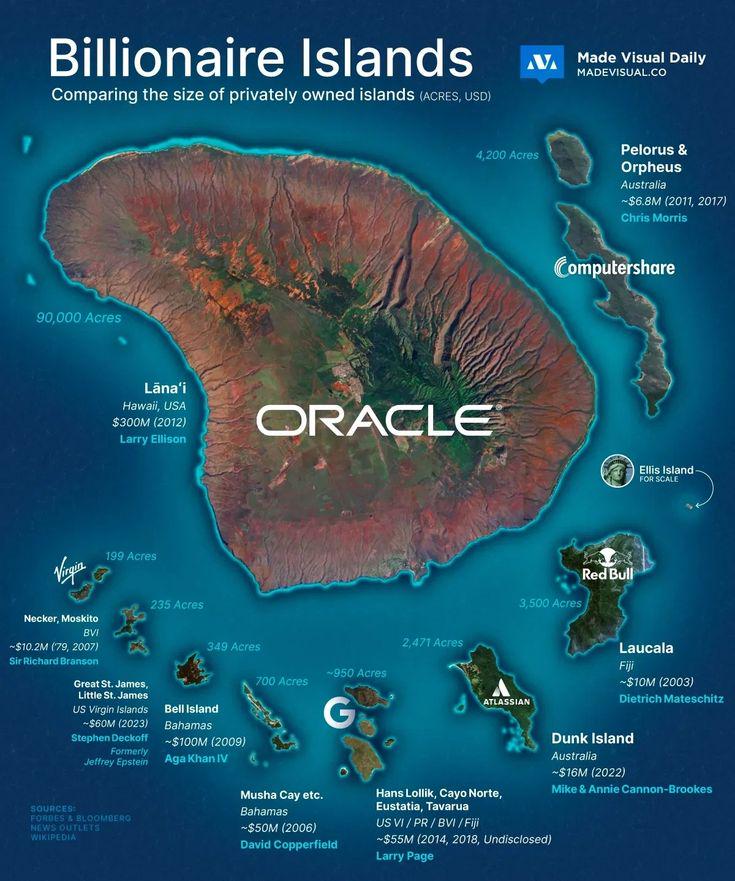
The size of billionaires' privately owned islands Visualization
This data visualization displays "The size of billionaires' privately owned islands" and provides a clear visual represe...
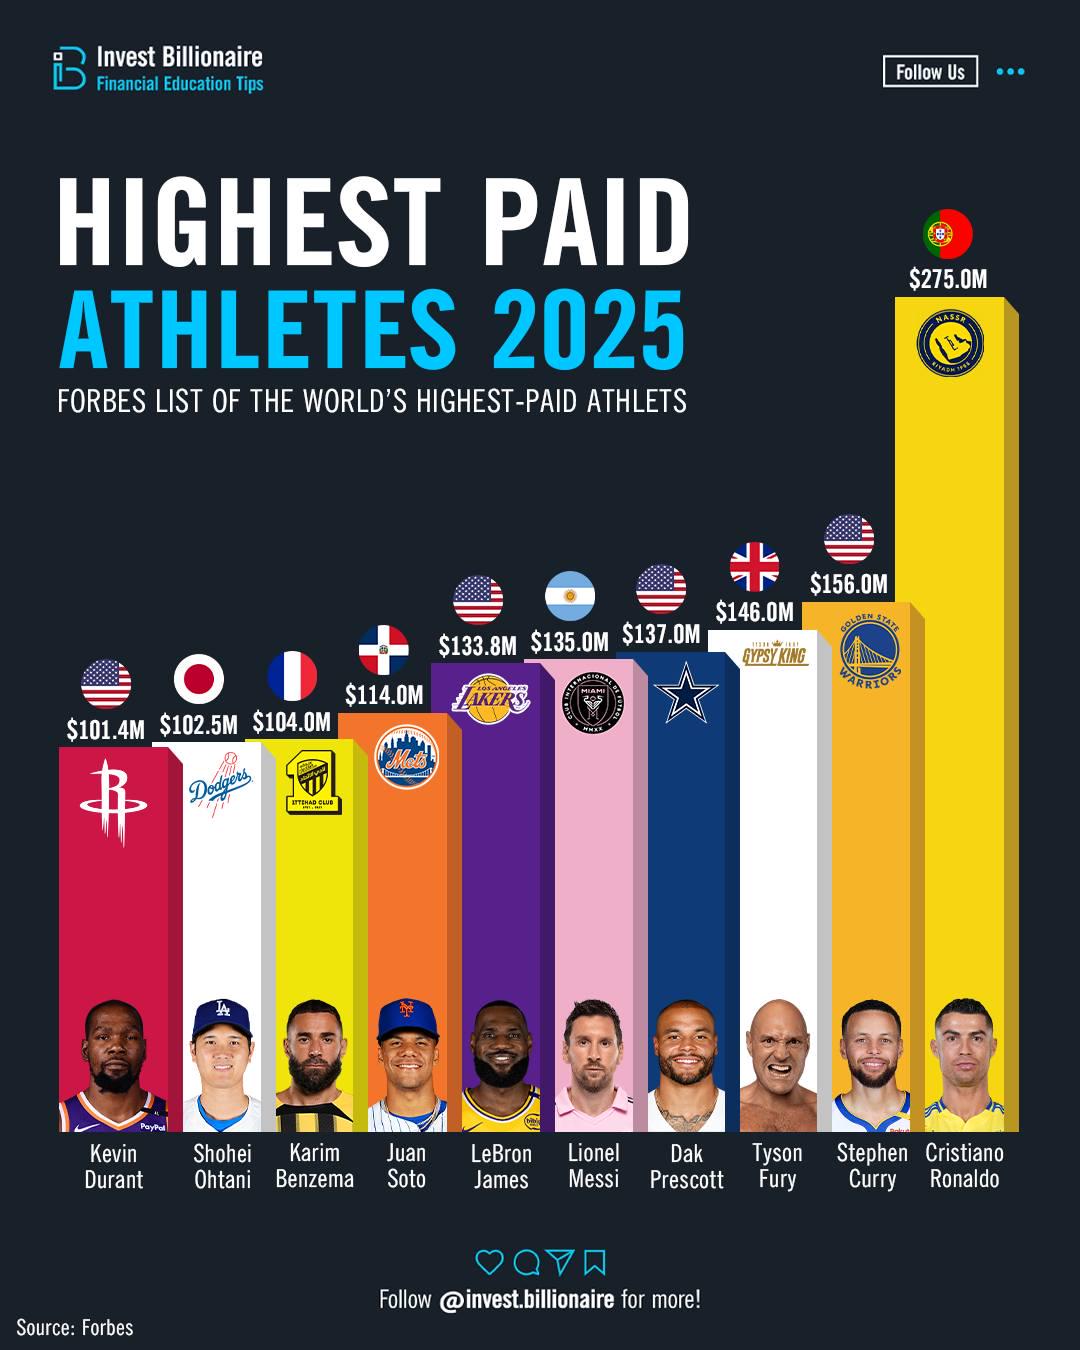
Not all elite athletes are paid the same Visualization
This data visualization displays "Not all elite athletes are paid the same" and provides a clear visual representation o...
![[OC] For the past 3 years I've polled people on Blind at my company (FAANG) about how worried they are about AI replacing them Visualization [OC] For the past 3 years I've polled people on Blind at my company (FAANG) about how worried they are about AI replacing them Visualization](/api/images/reddit-maps/1qp1n0r_1769580001689.jpg)
[OC] For the past 3 years I've polled people on Blind at my company (FAANG) about how worried they are about AI replacing them Visualization
This data visualization displays "[OC] For the past 3 years I've polled people on Blind at my company (FAANG) about how ...
![[OC] The Educational Attainment Of Major News Audiences Visualization [OC] The Educational Attainment Of Major News Audiences Visualization](/api/images/reddit-maps/1qc93sz_1768413603699.jpg)
[OC] The Educational Attainment Of Major News Audiences Visualization
This data visualization displays "[OC] The Educational Attainment Of Major News Audiences" and provides a clear visual r...
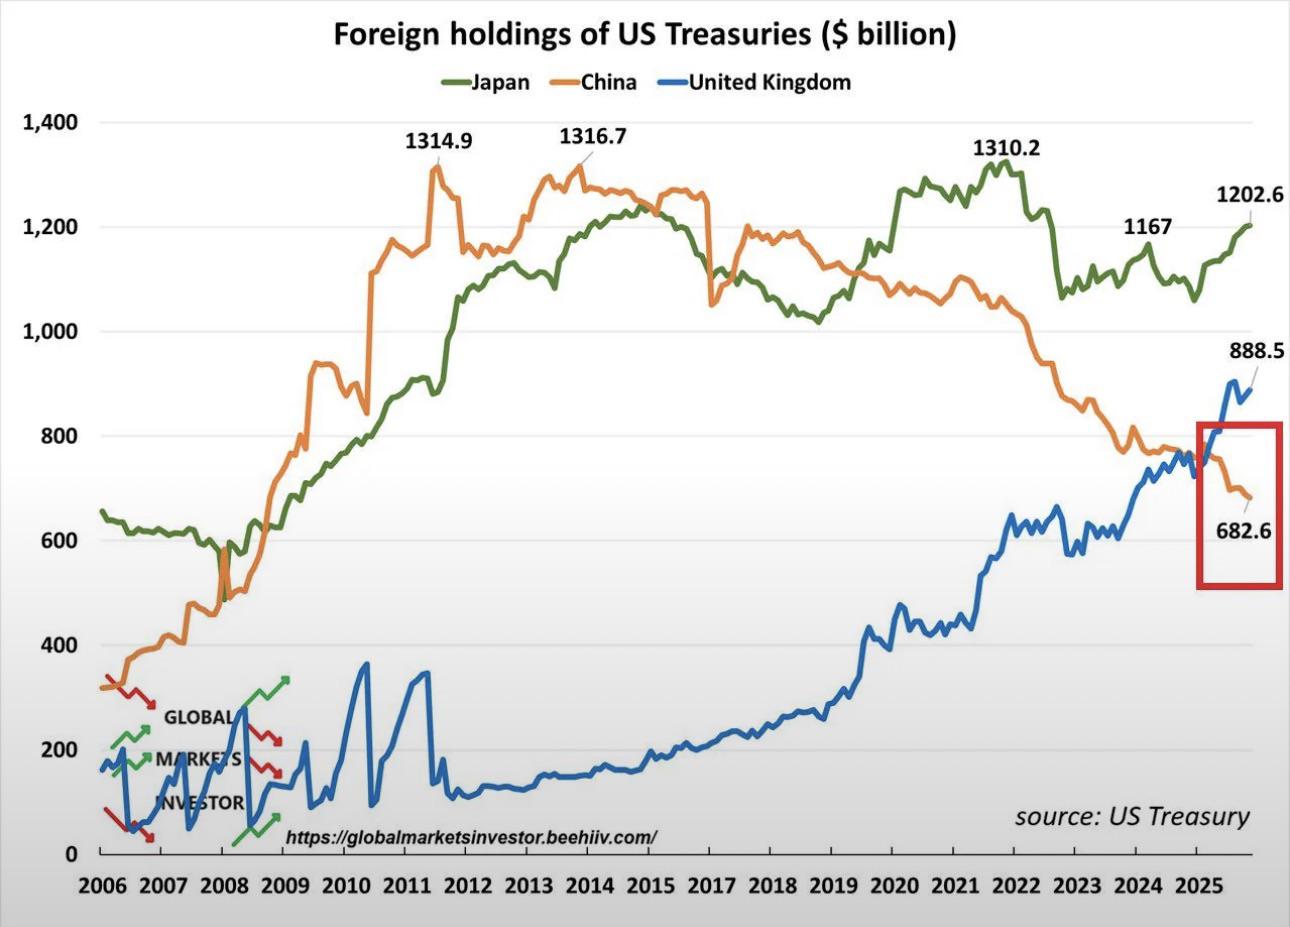
China is steadily dumping U.S Treasuries. Visualization
This data visualization displays "China is steadily dumping U.S Treasuries." and provides a clear visual representation ...
![[OC] Distance to the nearest road in Alaska Visualization [OC] Distance to the nearest road in Alaska Visualization](/api/images/reddit-maps/1qqkpmi_1769731201019.jpg)
[OC] Distance to the nearest road in Alaska Visualization
This data visualization displays "[OC] Distance to the nearest road in Alaska" and provides a clear visual representatio...
![[OC] 2 years of GF and me tracking mental health and habits. 9 of the most interesting effects. Visualization [OC] 2 years of GF and me tracking mental health and habits. 9 of the most interesting effects. Visualization](/api/images/reddit-maps/1qh7jo5_1768860004779.jpg)
[OC] 2 years of GF and me tracking mental health and habits. 9 of the most interesting effects. Visualization
This data visualization displays "[OC] 2 years of GF and me tracking mental health and habits. 9 of the most interesting...
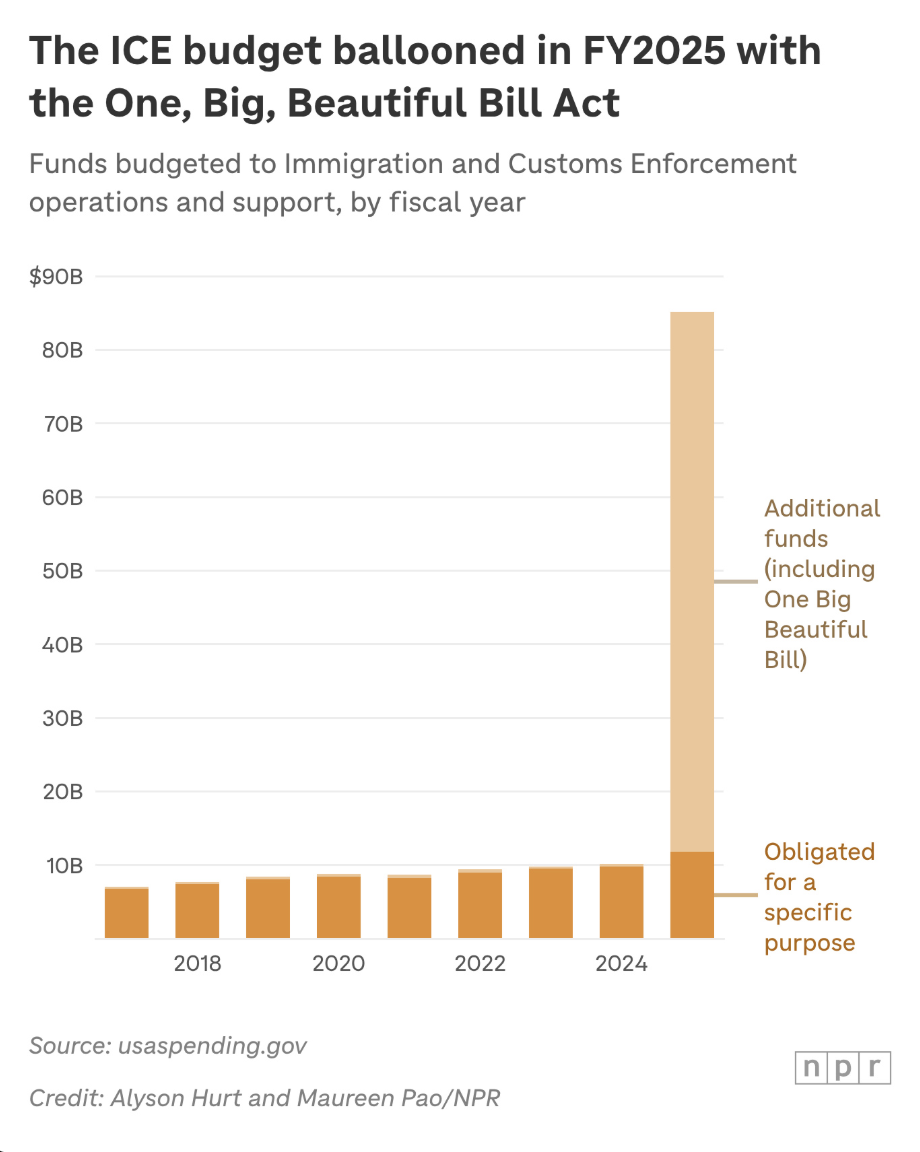
ICE's budget has skyrocketed during President Trump's second term, becoming the highest-funded U.S. law enforcement agency, with $85 billion now at its disposal. Visualization
This data visualization displays "ICE's budget has skyrocketed during President Trump's second term, becoming the highes...
![The complete blueprint of the world's first fully synthetic eukaryotic genome — Yeast 2.0 [OC] Visualization The complete blueprint of the world's first fully synthetic eukaryotic genome — Yeast 2.0 [OC] Visualization](/api/images/reddit-maps/1qiv6cw_1769011201488.jpg)
The complete blueprint of the world's first fully synthetic eukaryotic genome — Yeast 2.0 [OC] Visualization
This data visualization displays "The complete blueprint of the world's first fully synthetic eukaryotic genome — Yeast ...
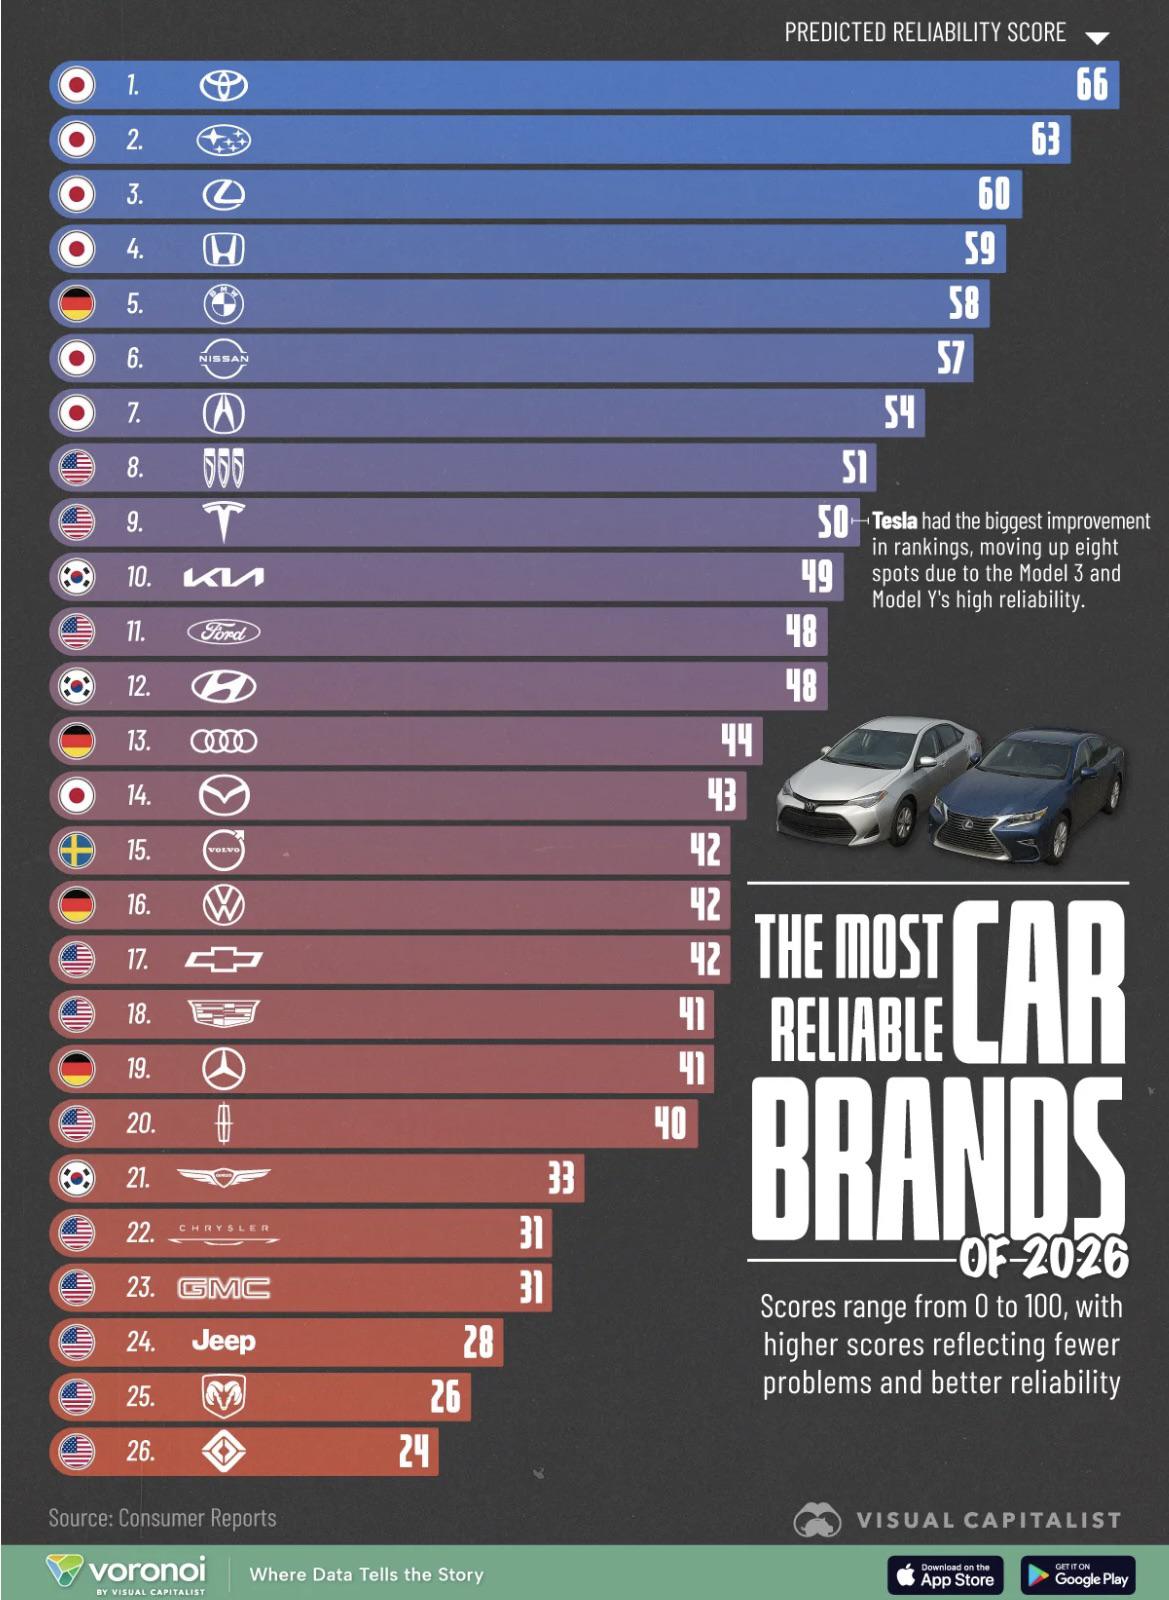
2026 most reliable cars ranked Visualization
This data visualization displays "2026 most reliable cars ranked" and provides a clear visual representation of the unde...
![21 days on Hinge - 31F [OC] Visualization 21 days on Hinge - 31F [OC] Visualization](/api/images/reddit-maps/1qnrqpr_1769464801044.jpg)
21 days on Hinge - 31F [OC] Visualization
This data visualization displays "21 days on Hinge - 31F [OC]" and provides a clear visual representation of the underly...
![[OC] Sales volatility in the video game industry Visualization [OC] Sales volatility in the video game industry Visualization](/api/images/reddit-maps/1qlonzk_1769270401444.jpg)
[OC] Sales volatility in the video game industry Visualization
This data visualization displays "[OC] Sales volatility in the video game industry" and provides a clear visual represen...
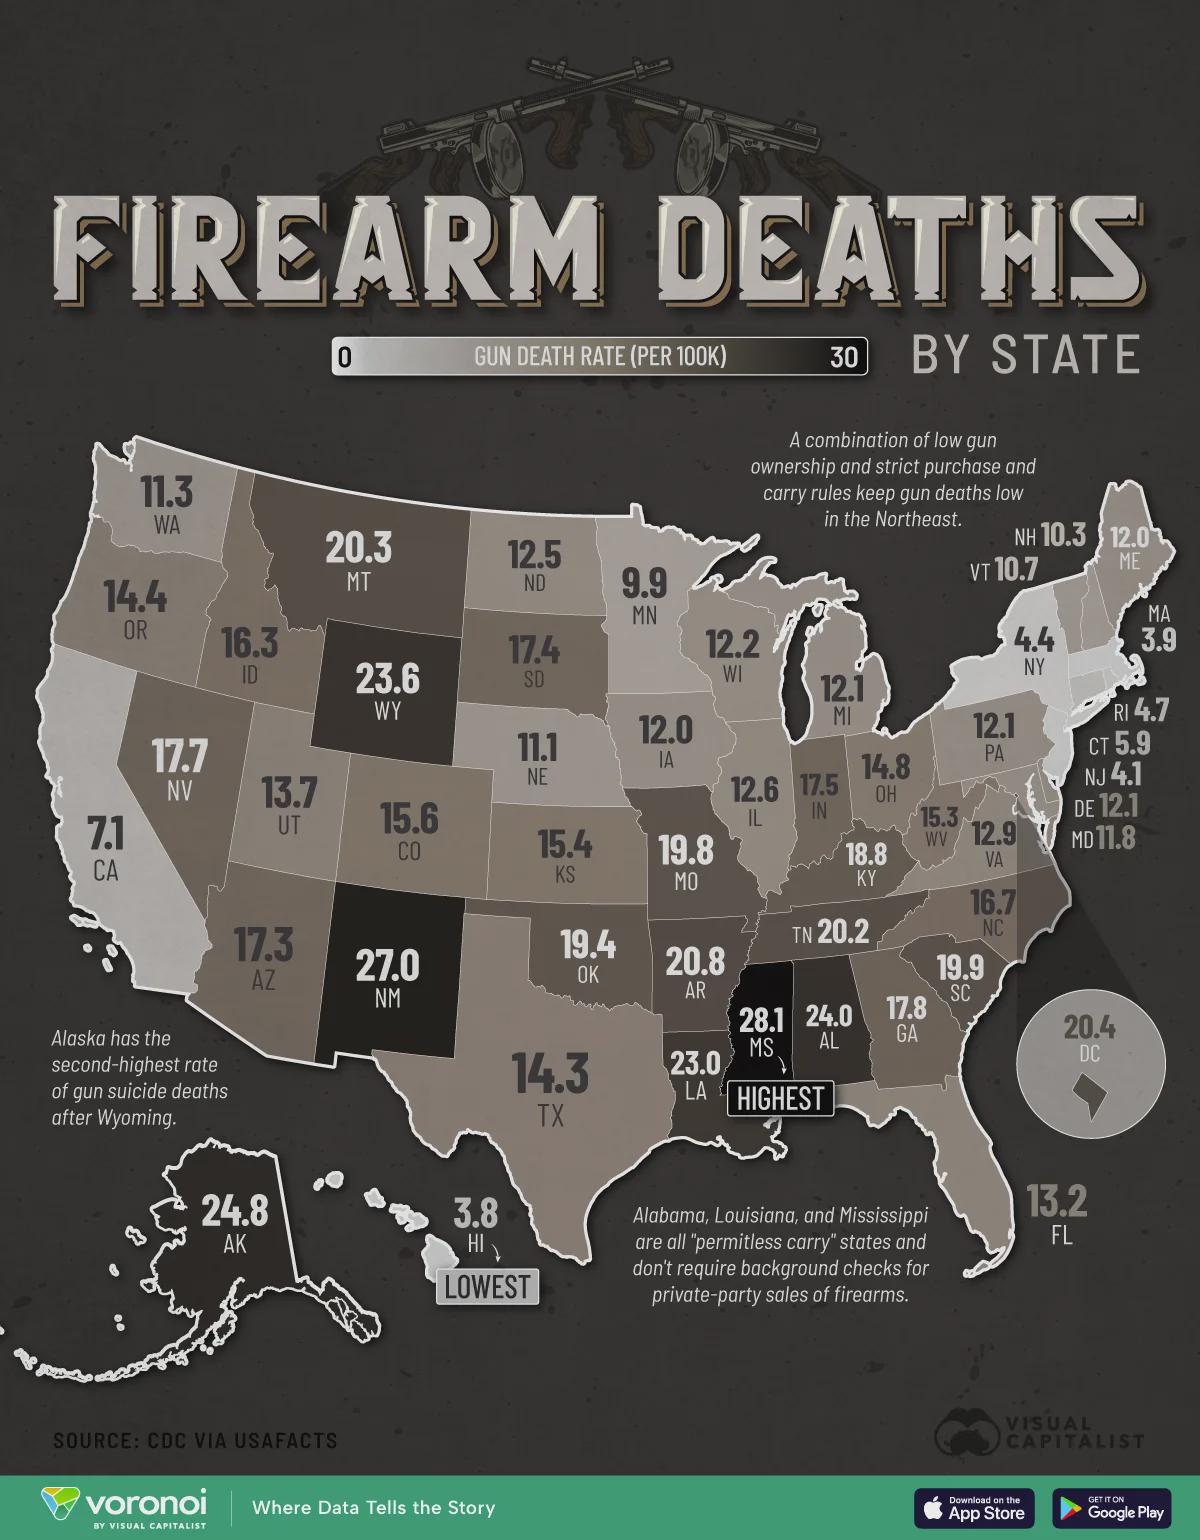
Mapped: Firearm Deaths by U.S. State Visualization
This data visualization displays "Mapped: Firearm Deaths by U.S. State" and provides a clear visual representation of th...
![[OC] Cybersecurity Vulnerabilities Discovered by Year Visualization [OC] Cybersecurity Vulnerabilities Discovered by Year Visualization](/api/images/reddit-maps/1qbvbs1_1768420801191.jpg)
[OC] Cybersecurity Vulnerabilities Discovered by Year Visualization
This data visualization displays "[OC] Cybersecurity Vulnerabilities Discovered by Year" and provides a clear visual rep...
![[OC] Day length change in minutes per week at 51 degrees north, the days are getting longer! Visualization [OC] Day length change in minutes per week at 51 degrees north, the days are getting longer! Visualization](/api/images/reddit-maps/1quvxte_1770141601129.jpg)
[OC] Day length change in minutes per week at 51 degrees north, the days are getting longer! Visualization
This data visualization displays "[OC] Day length change in minutes per week at 51 degrees north, the days are getting l...
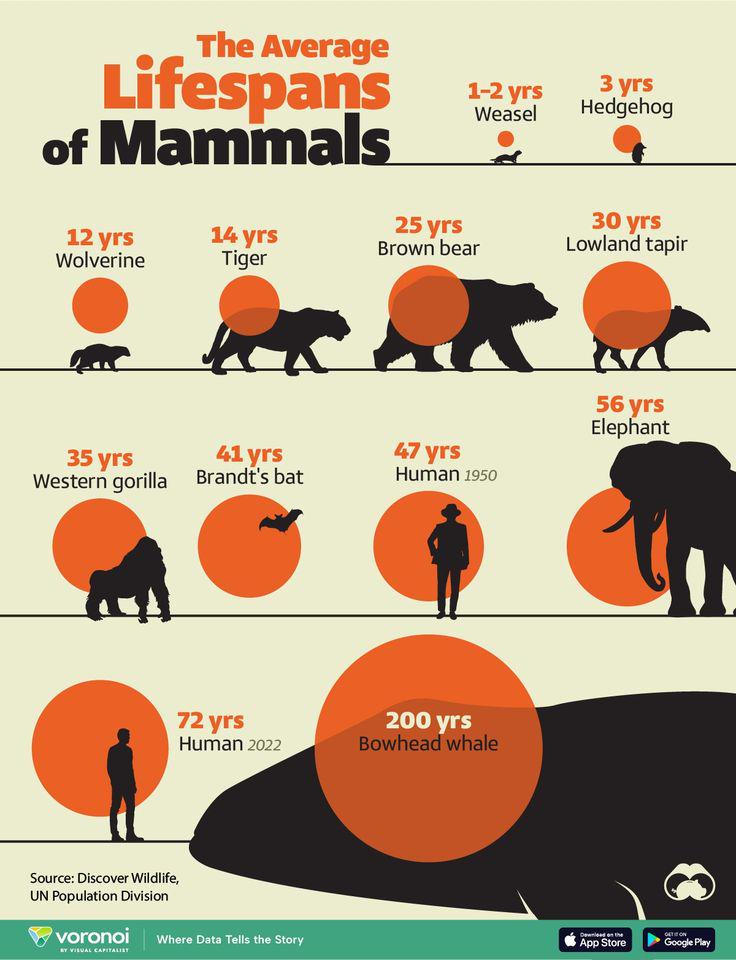
The average lifespans of mammals Visualization
This data visualization displays "The average lifespans of mammals" and provides a clear visual representation of the un...
![[OC] How differently Americans and Brits view English speaking countries Visualization [OC] How differently Americans and Brits view English speaking countries Visualization](/api/images/reddit-maps/1qdi19f_1768485601017.jpg)
[OC] How differently Americans and Brits view English speaking countries Visualization
This data visualization displays "[OC] How differently Americans and Brits view English speaking countries" and provides...
![[OC] The Most Expensive TV Shows Of All-Time Visualization [OC] The Most Expensive TV Shows Of All-Time Visualization](/api/images/reddit-maps/1qu02vf_1770069601533.jpg)
[OC] The Most Expensive TV Shows Of All-Time Visualization
This data visualization displays "[OC] The Most Expensive TV Shows Of All-Time" and provides a clear visual representati...
![[OC] Earth color Visualization [OC] Earth color Visualization](/api/images/reddit-maps/1qnh85y_1769443201223.jpg)
[OC] Earth color Visualization
This data visualization displays "[OC] Earth color" and provides a clear visual representation of the underlying data pa...
![[OC] Lake Erie Ice Concentration Winter 25-26 Visualization [OC] Lake Erie Ice Concentration Winter 25-26 Visualization](/api/images/reddit-maps/1qptpji_1769652001123.jpg)
[OC] Lake Erie Ice Concentration Winter 25-26 Visualization
This data visualization displays "[OC] Lake Erie Ice Concentration Winter 25-26" and provides a clear visual representat...
![My 2025 in clothes: a breakdown of what I wore vs what's in my closet [OC] Comparison My 2025 in clothes: a breakdown of what I wore vs what's in my closet [OC] Comparison](/api/images/reddit-maps/1qb6sfn_1768449604131.jpg)
My 2025 in clothes: a breakdown of what I wore vs what's in my closet [OC] Comparison
This data visualization displays "My 2025 in clothes: a breakdown of what I wore vs what's in my closet [OC]" and provid...
![World Cup - All Time Top Scorers [OC] Visualization World Cup - All Time Top Scorers [OC] Visualization](/api/images/reddit-maps/1qb8jo9_1768442404369.jpg)
World Cup - All Time Top Scorers [OC] Visualization
This data visualization displays "World Cup - All Time Top Scorers [OC]" and provides a clear visual representation of t...

US political divisions according to a Japanese newspaper Visualization
This data visualization displays "US political divisions according to a Japanese newspaper" and provides a clear visual ...
![[OC] I turned data on luggage mishandling into a sticker for my suitcase Statistics [OC] I turned data on luggage mishandling into a sticker for my suitcase Statistics](/api/images/reddit-maps/1qppkvh_1769644802322.jpg)
[OC] I turned data on luggage mishandling into a sticker for my suitcase Statistics
This data visualization displays "[OC] I turned data on luggage mishandling into a sticker for my suitcase" and provides...
![[OC] ICE's budget has surged under Trump to become the highest-funded federal law enforcement agency Visualization [OC] ICE's budget has surged under Trump to become the highest-funded federal law enforcement agency Visualization](/api/images/reddit-maps/1qqgm7z_1769716800995.jpg)
[OC] ICE's budget has surged under Trump to become the highest-funded federal law enforcement agency Visualization
This data visualization displays "[OC] ICE's budget has surged under Trump to become the highest-funded federal law enfo...
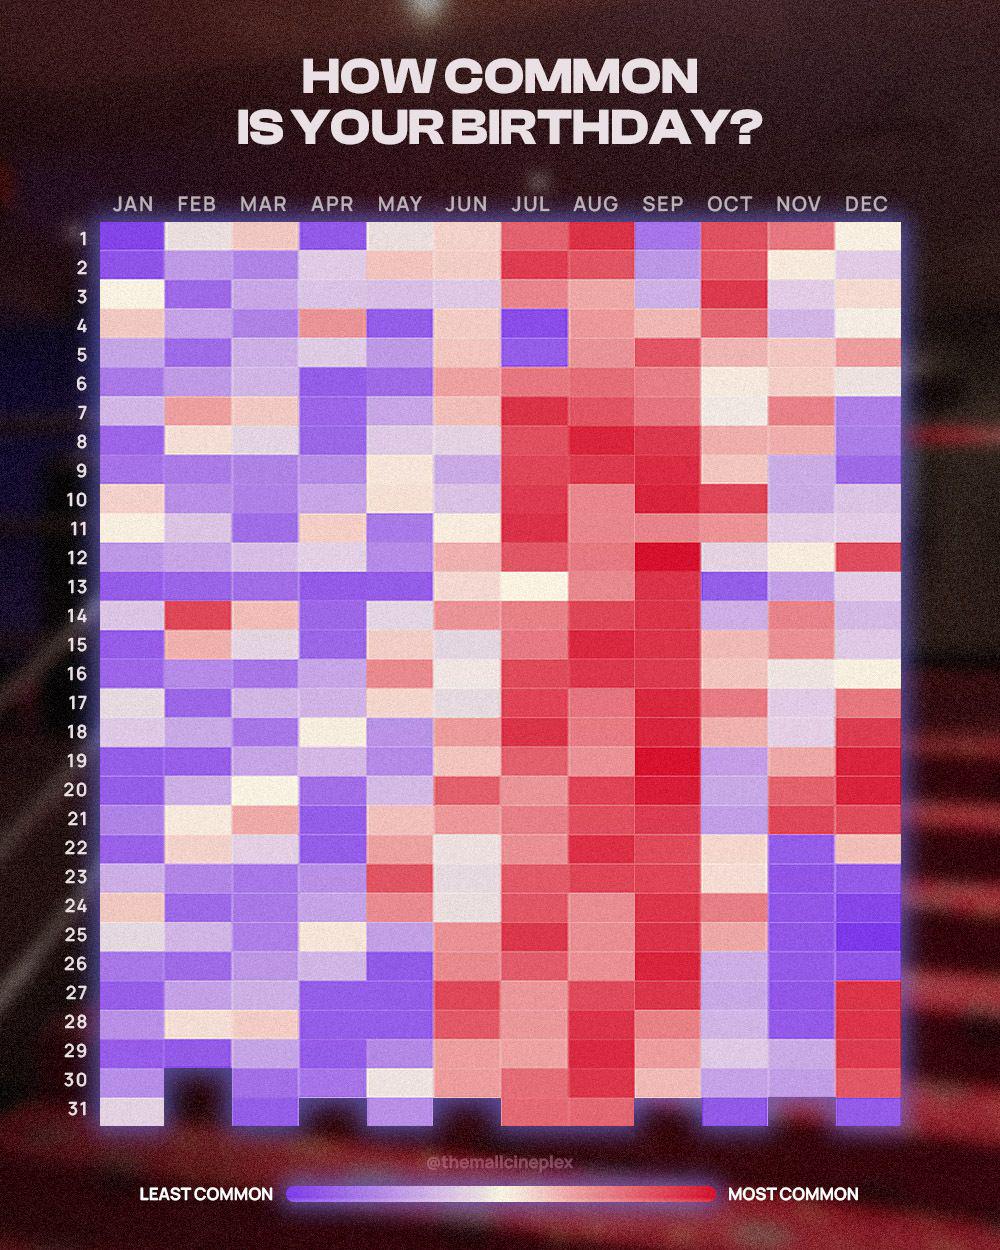
How common is your birthday? Visualization
This data visualization displays "How common is your birthday?" and provides a clear visual representation of the underl...
![Radioactive decay products of lithium-11 [OC] Visualization Radioactive decay products of lithium-11 [OC] Visualization](/api/images/reddit-maps/1qqdxtc_1769709601014.jpg)
Radioactive decay products of lithium-11 [OC] Visualization
This data visualization displays "Radioactive decay products of lithium-11 [OC]" and provides a clear visual representat...
![[OC] 12+ Years of messaging my wife on WhatsApp and iMessage Visualization [OC] 12+ Years of messaging my wife on WhatsApp and iMessage Visualization](/api/images/reddit-maps/1qni2lz_1769443202363.jpg)
[OC] 12+ Years of messaging my wife on WhatsApp and iMessage Visualization
This data visualization displays "[OC] 12+ Years of messaging my wife on WhatsApp and iMessage" and provides a clear vis...
![[OC] The North-South Divide: Government Debt-to-GDP Ratios in the European Union Visualization [OC] The North-South Divide: Government Debt-to-GDP Ratios in the European Union Visualization](/api/images/reddit-maps/1qkpn7e_1769184001104.jpg)
[OC] The North-South Divide: Government Debt-to-GDP Ratios in the European Union Visualization
This data visualization displays "[OC] The North-South Divide: Government Debt-to-GDP Ratios in the European Union" and ...
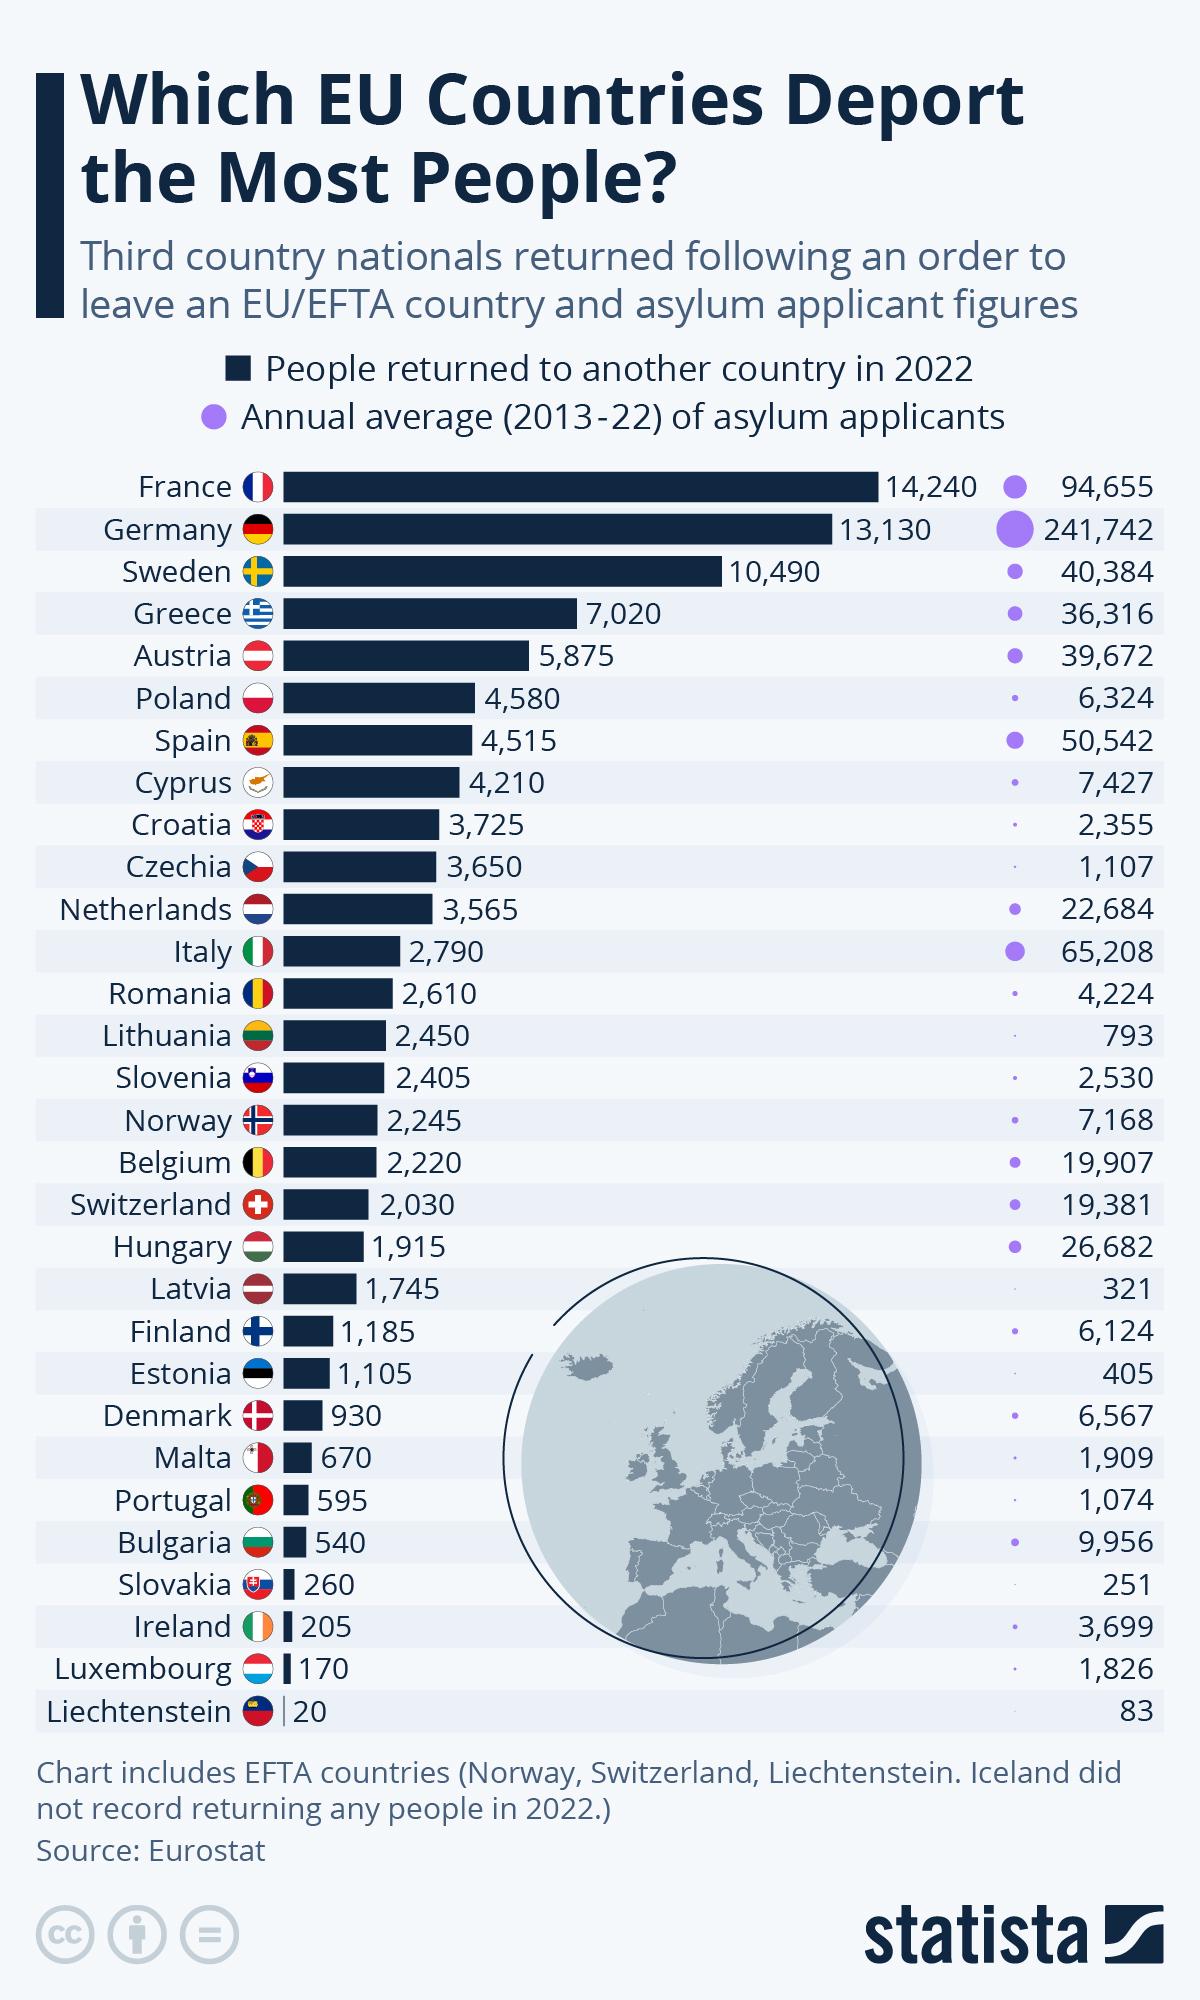
An infographic of which countries in the European union deports the most people.
This data visualization displays "An infographic of which countries in the European union deports the most people." and ...
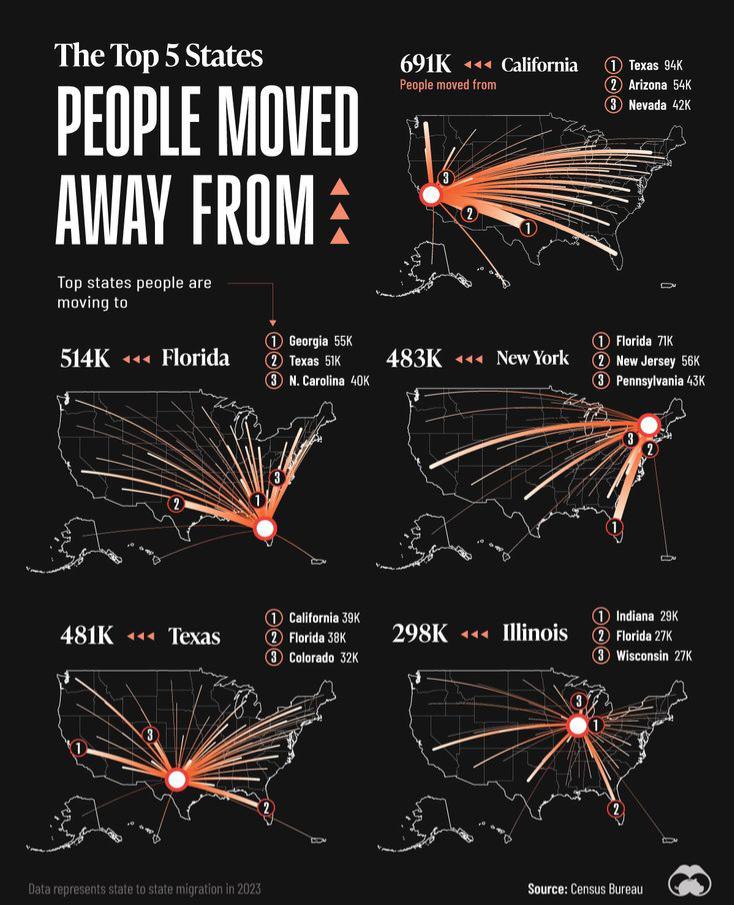
The Top 5 US States People Moved Away From Visualization
This data visualization displays "The Top 5 US States People Moved Away From" and provides a clear visual representation...
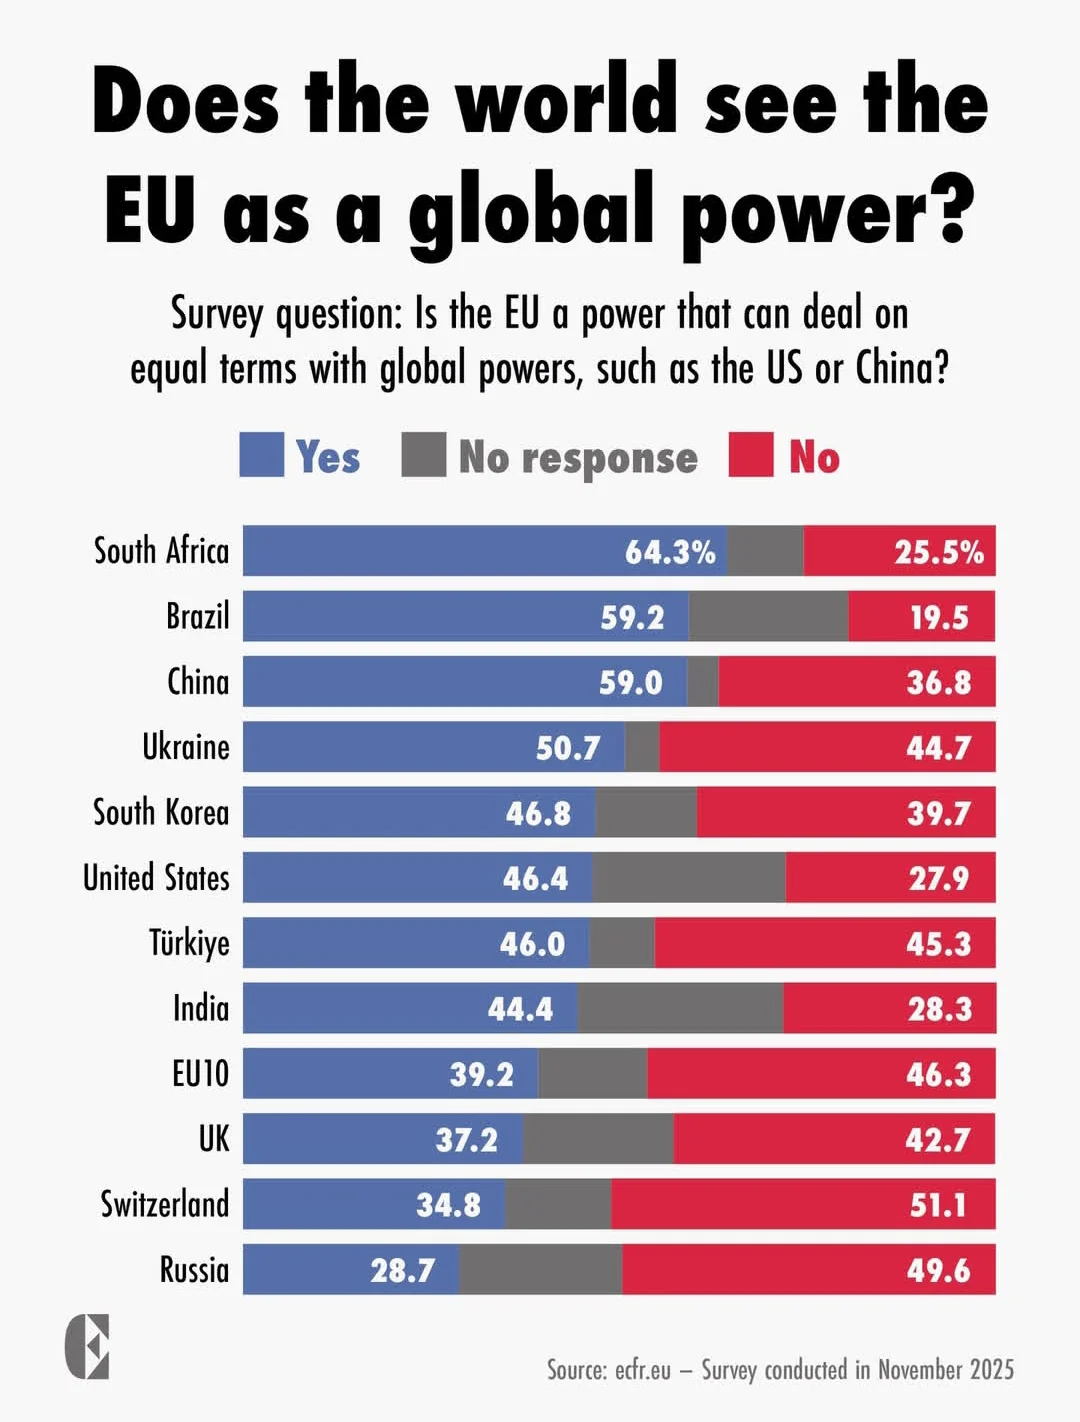
Survey: Does the world see the EU as a global power? Visualization
This data visualization displays "Survey: Does the world see the EU as a global power?" and provides a clear visual repr...
![[OC] Cost of Living (rent included) in European Cities in 2026 (Normalized by top city Zurich=100 as the baseline) Visualization [OC] Cost of Living (rent included) in European Cities in 2026 (Normalized by top city Zurich=100 as the baseline) Visualization](/api/images/reddit-maps/1qnc3ib_1769428801680.jpg)
[OC] Cost of Living (rent included) in European Cities in 2026 (Normalized by top city Zurich=100 as the baseline) Visualization
This data visualization displays "[OC] Cost of Living (rent included) in European Cities in 2026 (Normalized by top city...
![[OC] Average public pension compared to retirement expenses in Europe Visualization [OC] Average public pension compared to retirement expenses in Europe Visualization](/api/images/reddit-maps/1qokyki_1769544001268.jpg)
[OC] Average public pension compared to retirement expenses in Europe Visualization
This data visualization displays "[OC] Average public pension compared to retirement expenses in Europe" and provides a ...
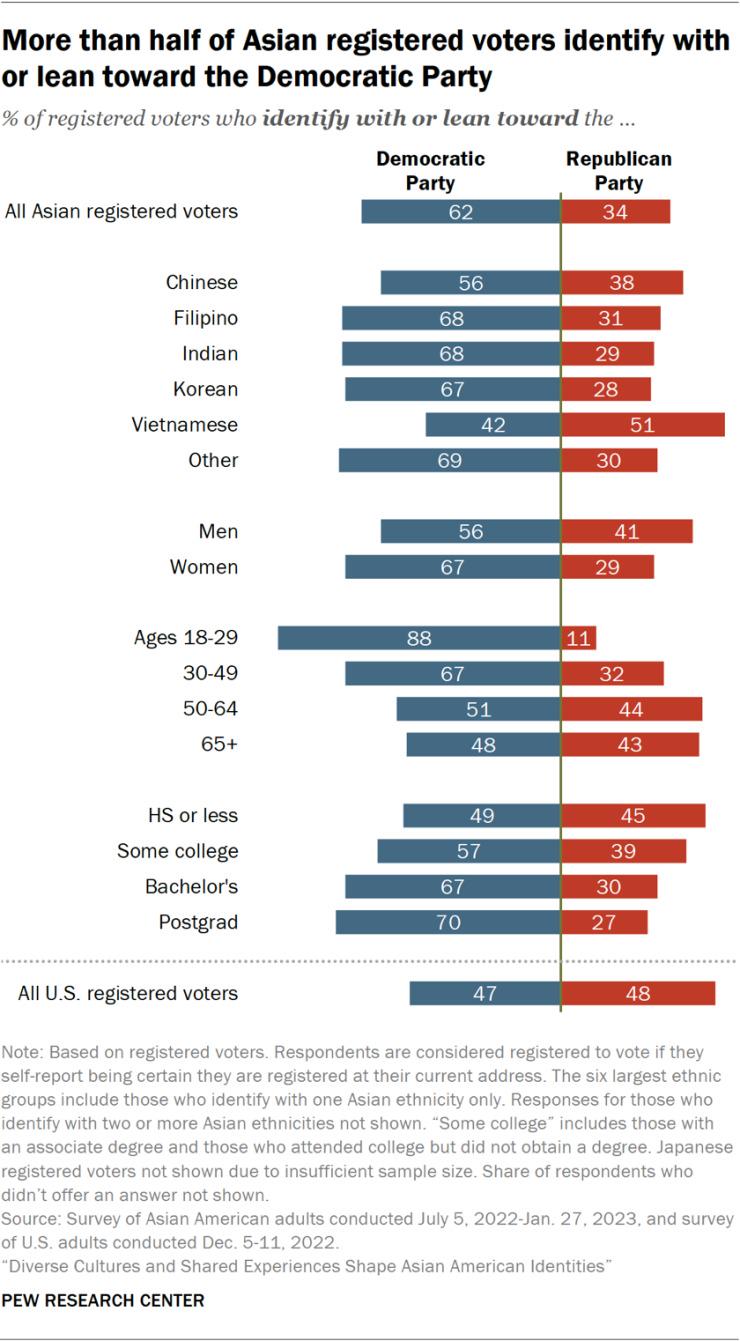
How Asian American voters lean: Democrat vs Republican (Pew Research) Comparison
This data visualization displays "How Asian American voters lean: Democrat vs Republican (Pew Research)" and provides a ...
![[OC] Current state of age verification for pornography in the US. [OC] Current state of age verification for pornography in the US.](/api/images/reddit-maps/1qv6ywg_1770163201429.jpg)
[OC] Current state of age verification for pornography in the US.
This data visualization displays "[OC] Current state of age verification for pornography in the US." and provides a clea...
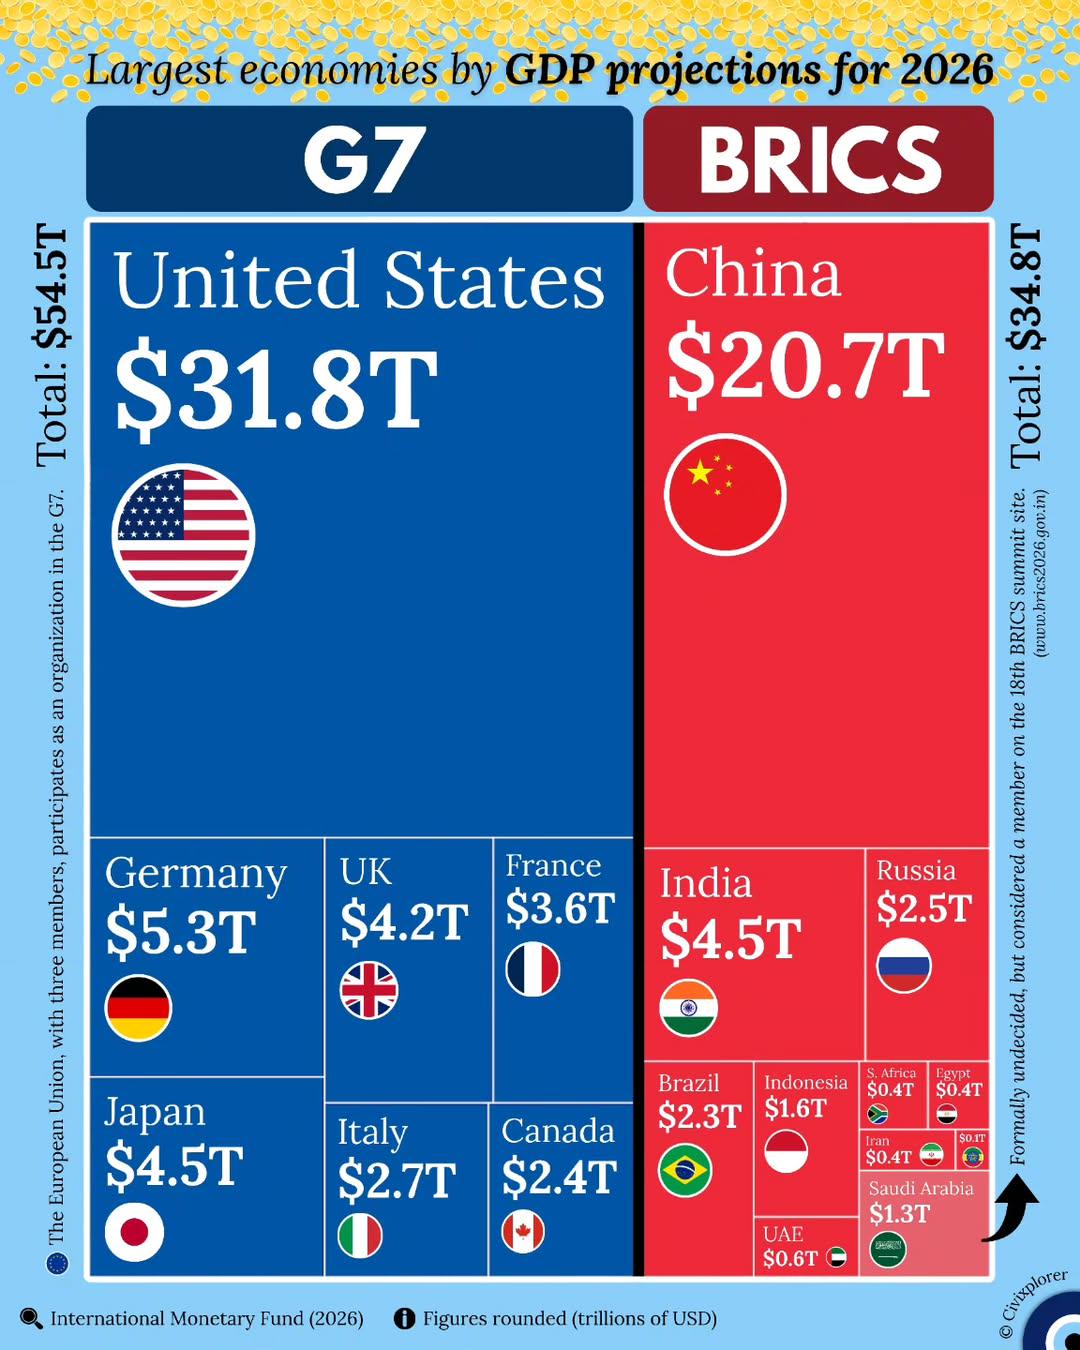
Largest economies by GDP projections for 2026 Visualization
This data visualization displays "Largest economies by GDP projections for 2026" and provides a clear visual representat...