information-design Maps
260 geographic visualizations tagged with "information-design"
![I analyzed 12 years of iMessages to compare my texting habits with my girlfirend, mom, dad, and the boys [OC] Visualization I analyzed 12 years of iMessages to compare my texting habits with my girlfirend, mom, dad, and the boys [OC] Visualization](/api/images/reddit-maps/1qb234f_1768442402099.jpg)
I analyzed 12 years of iMessages to compare my texting habits with my girlfirend, mom, dad, and the boys [OC] Visualization
This data visualization displays "I analyzed 12 years of iMessages to compare my texting habits with my girlfirend, mom,...
![A Quarter Century of Television [OC] Visualization A Quarter Century of Television [OC] Visualization](/api/images/reddit-maps/1qaq7kz_1768442402792.jpg)
A Quarter Century of Television [OC] Visualization
This data visualization displays "A Quarter Century of Television [OC]" and provides a clear visual representation of th...
![[OC] The gender balance in different religions Visualization [OC] The gender balance in different religions Visualization](/api/images/reddit-maps/1qc5d4l_1768413602834.jpg)
[OC] The gender balance in different religions Visualization
This data visualization displays "[OC] The gender balance in different religions" and provides a clear visual representa...
![[OC] NATO coalition personnel fatalities in Afghanistan Visualization [OC] NATO coalition personnel fatalities in Afghanistan Visualization](/api/images/reddit-maps/1qkmypn_1769169601011.jpg)
[OC] NATO coalition personnel fatalities in Afghanistan Visualization
This data visualization displays "[OC] NATO coalition personnel fatalities in Afghanistan" and provides a clear visual r...
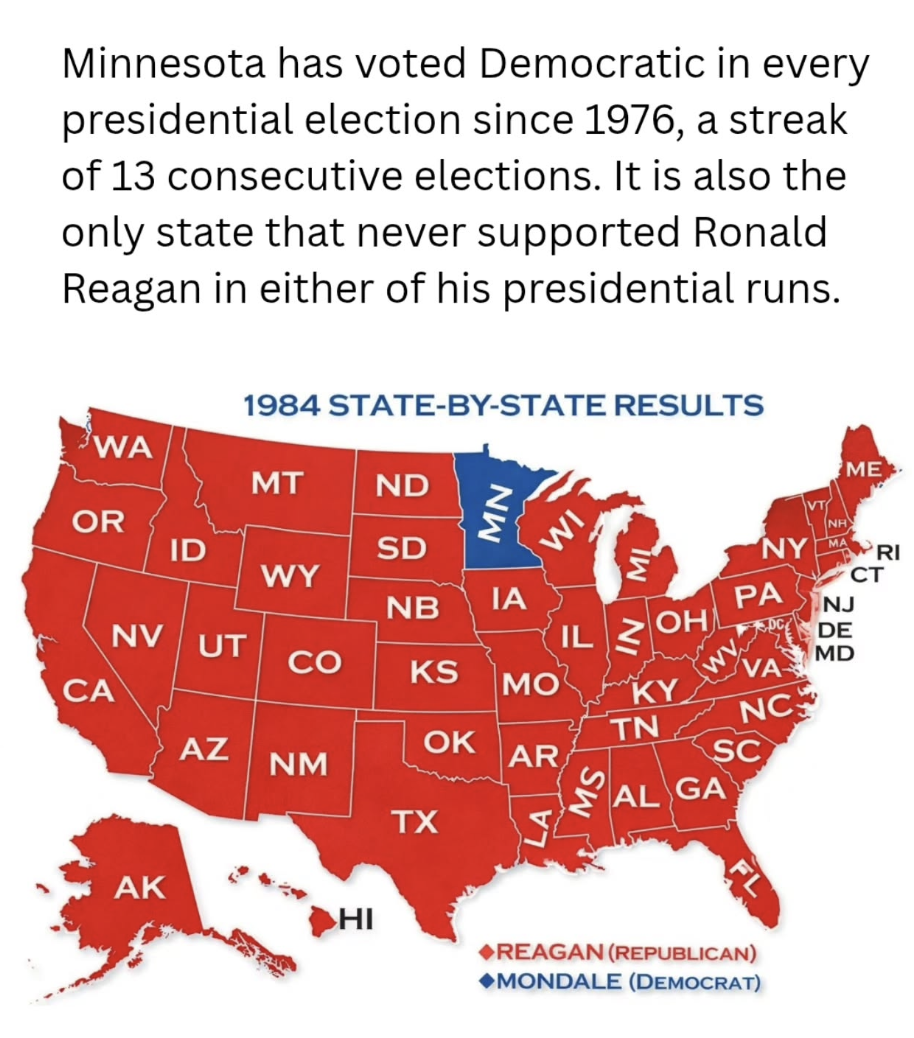
Minnesota has voted for the Democratic nominee in every presidential election since 1976. Visualization
This data visualization displays "Minnesota has voted for the Democratic nominee in every presidential election since 19...
![[OC] Presidents and VPs Mentioned by Trump Visualization [OC] Presidents and VPs Mentioned by Trump Visualization](/api/images/reddit-maps/1qk77w5_1769126401114.jpg)
[OC] Presidents and VPs Mentioned by Trump Visualization
This data visualization displays "[OC] Presidents and VPs Mentioned by Trump" and provides a clear visual representation...
![[OC] Does the news reflect what we die from? Visualization [OC] Does the news reflect what we die from? Visualization](/api/images/reddit-maps/1qq4m2v_1769695201033.jpg)
[OC] Does the news reflect what we die from? Visualization
This data visualization displays "[OC] Does the news reflect what we die from?" and provides a clear visual representati...
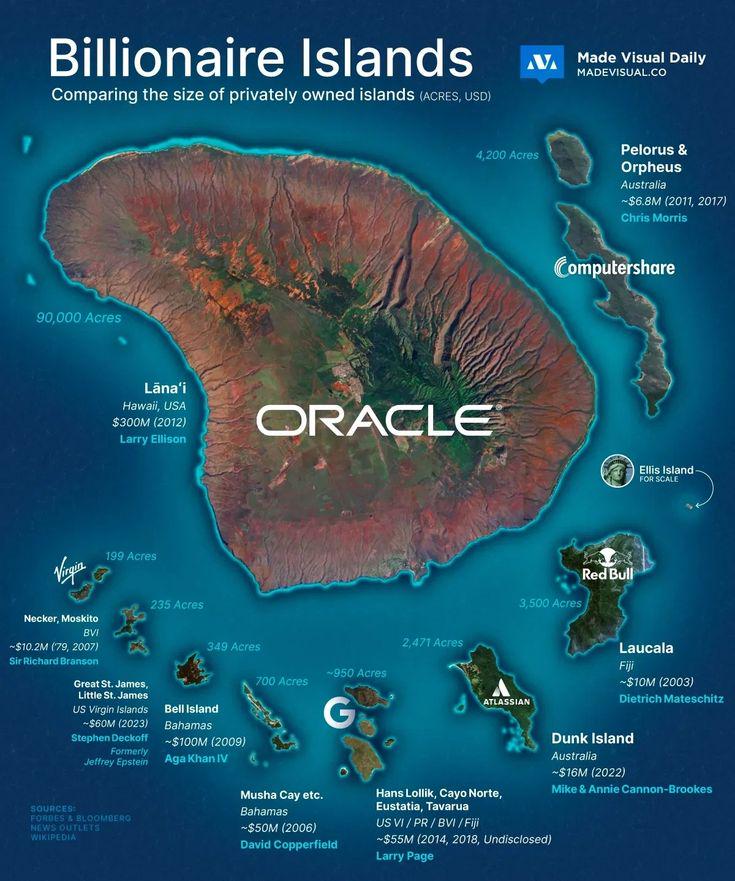
The size of billionaires' privately owned islands Visualization
This data visualization displays "The size of billionaires' privately owned islands" and provides a clear visual represe...
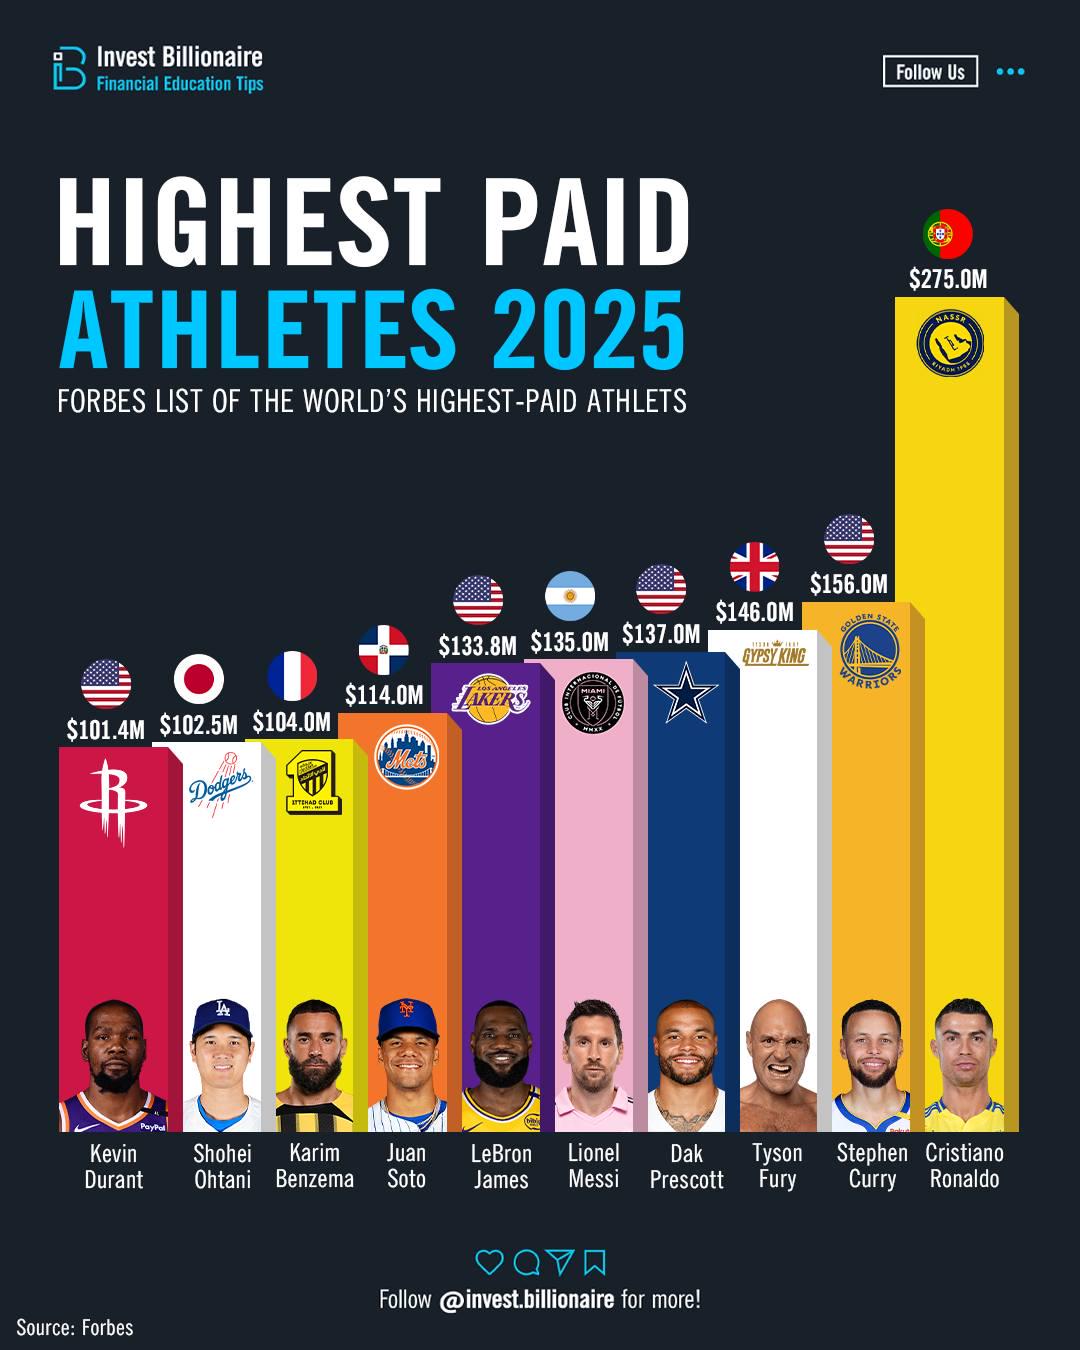
Not all elite athletes are paid the same Visualization
This data visualization displays "Not all elite athletes are paid the same" and provides a clear visual representation o...
![[OC] Distance to the nearest road in Alaska Visualization [OC] Distance to the nearest road in Alaska Visualization](/api/images/reddit-maps/1qqkpmi_1769731201019.jpg)
[OC] Distance to the nearest road in Alaska Visualization
This data visualization displays "[OC] Distance to the nearest road in Alaska" and provides a clear visual representatio...
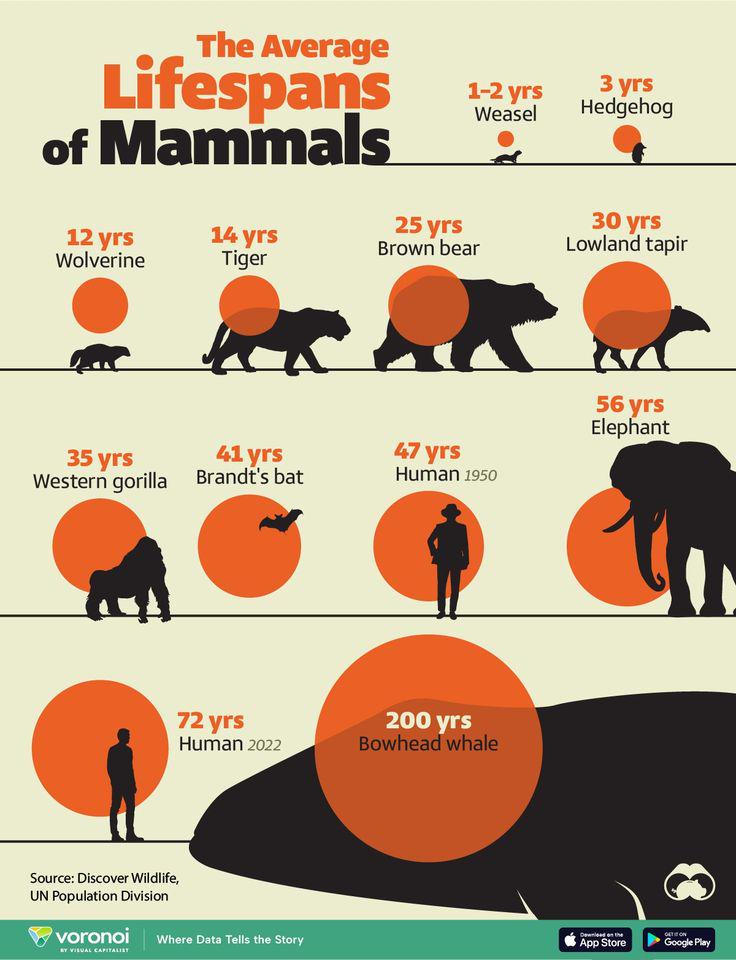
The average lifespans of mammals Visualization
This data visualization displays "The average lifespans of mammals" and provides a clear visual representation of the un...
![[OC] How differently Americans and Brits view English speaking countries Visualization [OC] How differently Americans and Brits view English speaking countries Visualization](/api/images/reddit-maps/1qdi19f_1768485601017.jpg)
[OC] How differently Americans and Brits view English speaking countries Visualization
This data visualization displays "[OC] How differently Americans and Brits view English speaking countries" and provides...
![[OC] The Most Expensive TV Shows Of All-Time Visualization [OC] The Most Expensive TV Shows Of All-Time Visualization](/api/images/reddit-maps/1qu02vf_1770069601533.jpg)
[OC] The Most Expensive TV Shows Of All-Time Visualization
This data visualization displays "[OC] The Most Expensive TV Shows Of All-Time" and provides a clear visual representati...
![[OC] Earth color Visualization [OC] Earth color Visualization](/api/images/reddit-maps/1qnh85y_1769443201223.jpg)
[OC] Earth color Visualization
This data visualization displays "[OC] Earth color" and provides a clear visual representation of the underlying data pa...
![[OC] Lake Erie Ice Concentration Winter 25-26 Visualization [OC] Lake Erie Ice Concentration Winter 25-26 Visualization](/api/images/reddit-maps/1qptpji_1769652001123.jpg)
[OC] Lake Erie Ice Concentration Winter 25-26 Visualization
This data visualization displays "[OC] Lake Erie Ice Concentration Winter 25-26" and provides a clear visual representat...

US political divisions according to a Japanese newspaper Visualization
This data visualization displays "US political divisions according to a Japanese newspaper" and provides a clear visual ...
![[OC] ICE's budget has surged under Trump to become the highest-funded federal law enforcement agency Visualization [OC] ICE's budget has surged under Trump to become the highest-funded federal law enforcement agency Visualization](/api/images/reddit-maps/1qqgm7z_1769716800995.jpg)
[OC] ICE's budget has surged under Trump to become the highest-funded federal law enforcement agency Visualization
This data visualization displays "[OC] ICE's budget has surged under Trump to become the highest-funded federal law enfo...
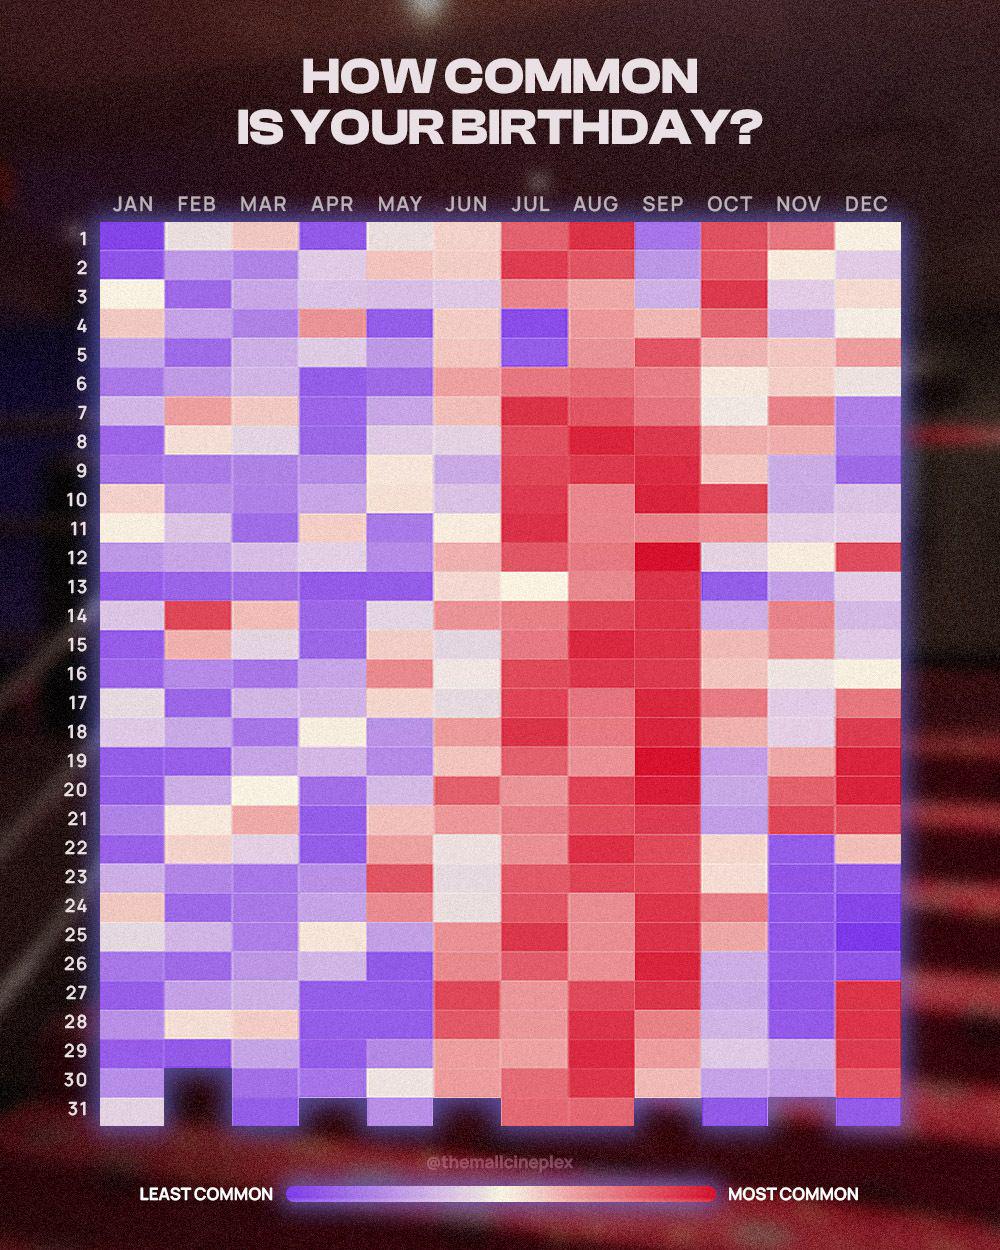
How common is your birthday? Visualization
This data visualization displays "How common is your birthday?" and provides a clear visual representation of the underl...
![Radioactive decay products of lithium-11 [OC] Visualization Radioactive decay products of lithium-11 [OC] Visualization](/api/images/reddit-maps/1qqdxtc_1769709601014.jpg)
Radioactive decay products of lithium-11 [OC] Visualization
This data visualization displays "Radioactive decay products of lithium-11 [OC]" and provides a clear visual representat...
![[OC] 12+ Years of messaging my wife on WhatsApp and iMessage Visualization [OC] 12+ Years of messaging my wife on WhatsApp and iMessage Visualization](/api/images/reddit-maps/1qni2lz_1769443202363.jpg)
[OC] 12+ Years of messaging my wife on WhatsApp and iMessage Visualization
This data visualization displays "[OC] 12+ Years of messaging my wife on WhatsApp and iMessage" and provides a clear vis...
![[OC] Cost of Living (rent included) in European Cities in 2026 (Normalized by top city Zurich=100 as the baseline) Visualization [OC] Cost of Living (rent included) in European Cities in 2026 (Normalized by top city Zurich=100 as the baseline) Visualization](/api/images/reddit-maps/1qnc3ib_1769428801680.jpg)
[OC] Cost of Living (rent included) in European Cities in 2026 (Normalized by top city Zurich=100 as the baseline) Visualization
This data visualization displays "[OC] Cost of Living (rent included) in European Cities in 2026 (Normalized by top city...
![[OC] Average public pension compared to retirement expenses in Europe Visualization [OC] Average public pension compared to retirement expenses in Europe Visualization](/api/images/reddit-maps/1qokyki_1769544001268.jpg)
[OC] Average public pension compared to retirement expenses in Europe Visualization
This data visualization displays "[OC] Average public pension compared to retirement expenses in Europe" and provides a ...
![We calculated the relative gravitational pull of Starbucks and Dunkin' locations near NFL stadiums to help predict the Super Bowl [OC] Visualization We calculated the relative gravitational pull of Starbucks and Dunkin' locations near NFL stadiums to help predict the Super Bowl [OC] Visualization](/api/images/reddit-maps/1qvnrfz_1770235202076.jpg)
We calculated the relative gravitational pull of Starbucks and Dunkin' locations near NFL stadiums to help predict the Super Bowl [OC] Visualization
This data visualization displays "We calculated the relative gravitational pull of Starbucks and Dunkin' locations near ...
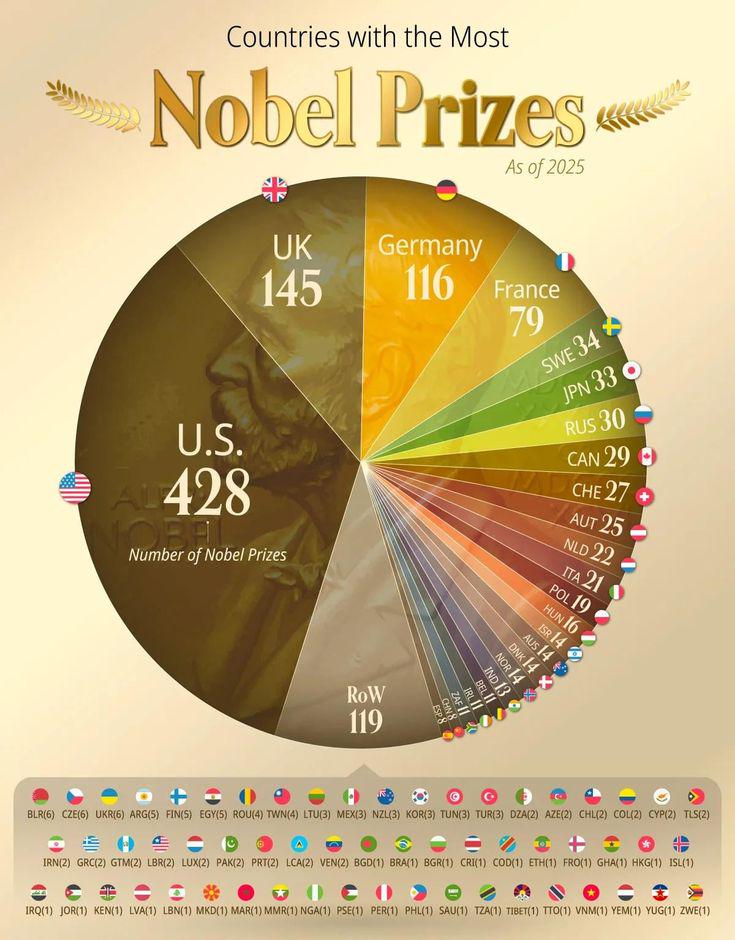
Countries with the most Nobel Prizes Visualization
This data visualization displays "Countries with the most Nobel Prizes" and provides a clear visual representation of th...
![Fewer Americans say they are “very happy” than they did 50 years ago. [OC] Visualization Fewer Americans say they are “very happy” than they did 50 years ago. [OC] Visualization](/api/images/reddit-maps/1qc6vtg_1768413605140.jpg)
Fewer Americans say they are “very happy” than they did 50 years ago. [OC] Visualization
This data visualization displays "Fewer Americans say they are “very happy” than they did 50 years ago. [OC]" and provid...
![[OC] The Solana Casino: Visualizing the fate of 23,250 memecoins. The grey void at the bottom are the thousands of projects that went to zero. Visualization [OC] The Solana Casino: Visualizing the fate of 23,250 memecoins. The grey void at the bottom are the thousands of projects that went to zero. Visualization](/api/images/reddit-maps/1qs661p_1769889601091.jpg)
[OC] The Solana Casino: Visualizing the fate of 23,250 memecoins. The grey void at the bottom are the thousands of projects that went to zero. Visualization
This data visualization displays "[OC] The Solana Casino: Visualizing the fate of 23,250 memecoins. The grey void at the...
![Life Expectancy in the US, Europe and Canada [OC] Visualization Life Expectancy in the US, Europe and Canada [OC] Visualization](/api/images/reddit-maps/1qi8gxl_1768939201064.jpg)
Life Expectancy in the US, Europe and Canada [OC] Visualization
This data visualization displays "Life Expectancy in the US, Europe and Canada [OC]" and provides a clear visual represe...
![[OC] 31/F lesbian, 4 months of Hinge. Visualization [OC] 31/F lesbian, 4 months of Hinge. Visualization](/api/images/reddit-maps/1qnm7f2_1769450401859.jpg)
[OC] 31/F lesbian, 4 months of Hinge. Visualization
This data visualization displays "[OC] 31/F lesbian, 4 months of Hinge." and provides a clear visual representation of t...
![[OC] My mood, tracked daily over 2025 Visualization [OC] My mood, tracked daily over 2025 Visualization](/api/images/reddit-maps/1qo0imd_1769486401257.jpg)
[OC] My mood, tracked daily over 2025 Visualization
This data visualization displays "[OC] My mood, tracked daily over 2025" and provides a clear visual representation of t...
![[OC] US Home Value by ZIP code Visualization [OC] US Home Value by ZIP code Visualization](/api/images/reddit-maps/1qhld35_1768874401239.jpg)
[OC] US Home Value by ZIP code Visualization
This data visualization displays "[OC] US Home Value by ZIP code" and provides a clear visual representation of the unde...

Super Mario Bros pixel sprite evolution Visualization
This data visualization displays "Super Mario Bros pixel sprite evolution" and provides a clear visual representation of...
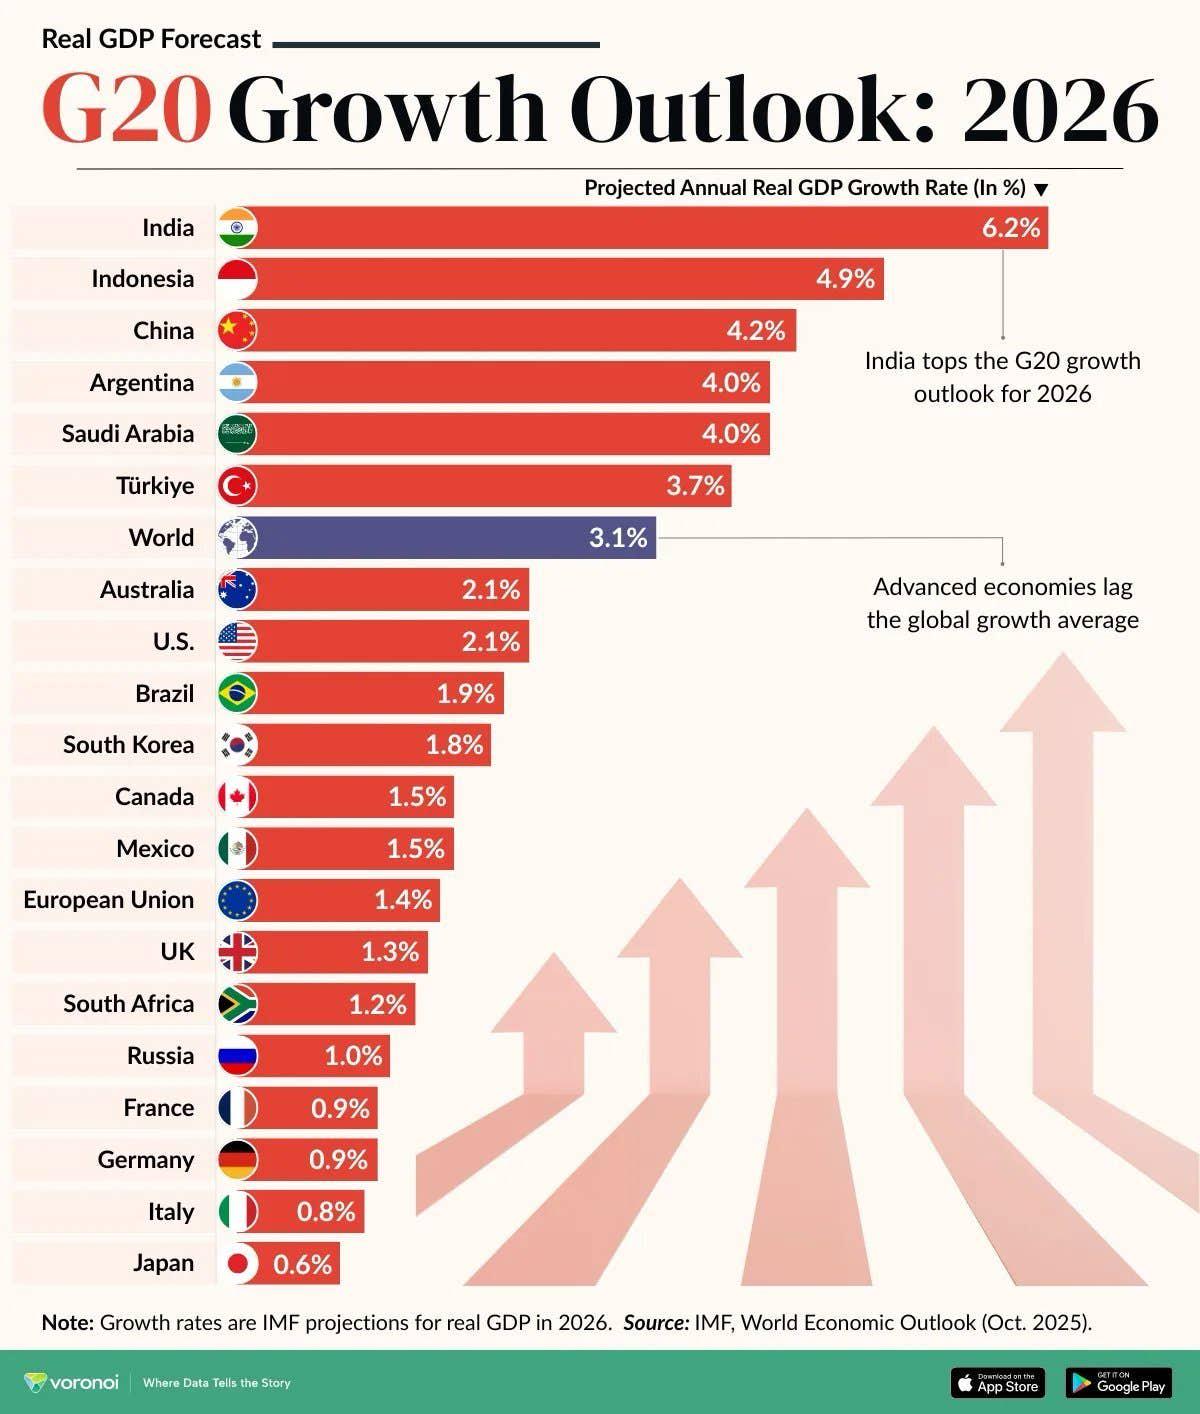
G20 gdp growth forecast 2026 Visualization
This data visualization displays "G20 gdp growth forecast 2026" and provides a clear visual representation of the underl...
![[OC] Piano learning retention by enrollment month Visualization [OC] Piano learning retention by enrollment month Visualization](/api/images/reddit-maps/1qj71ne_1769025601149.jpg)
[OC] Piano learning retention by enrollment month Visualization
This data visualization displays "[OC] Piano learning retention by enrollment month" and provides a clear visual represe...
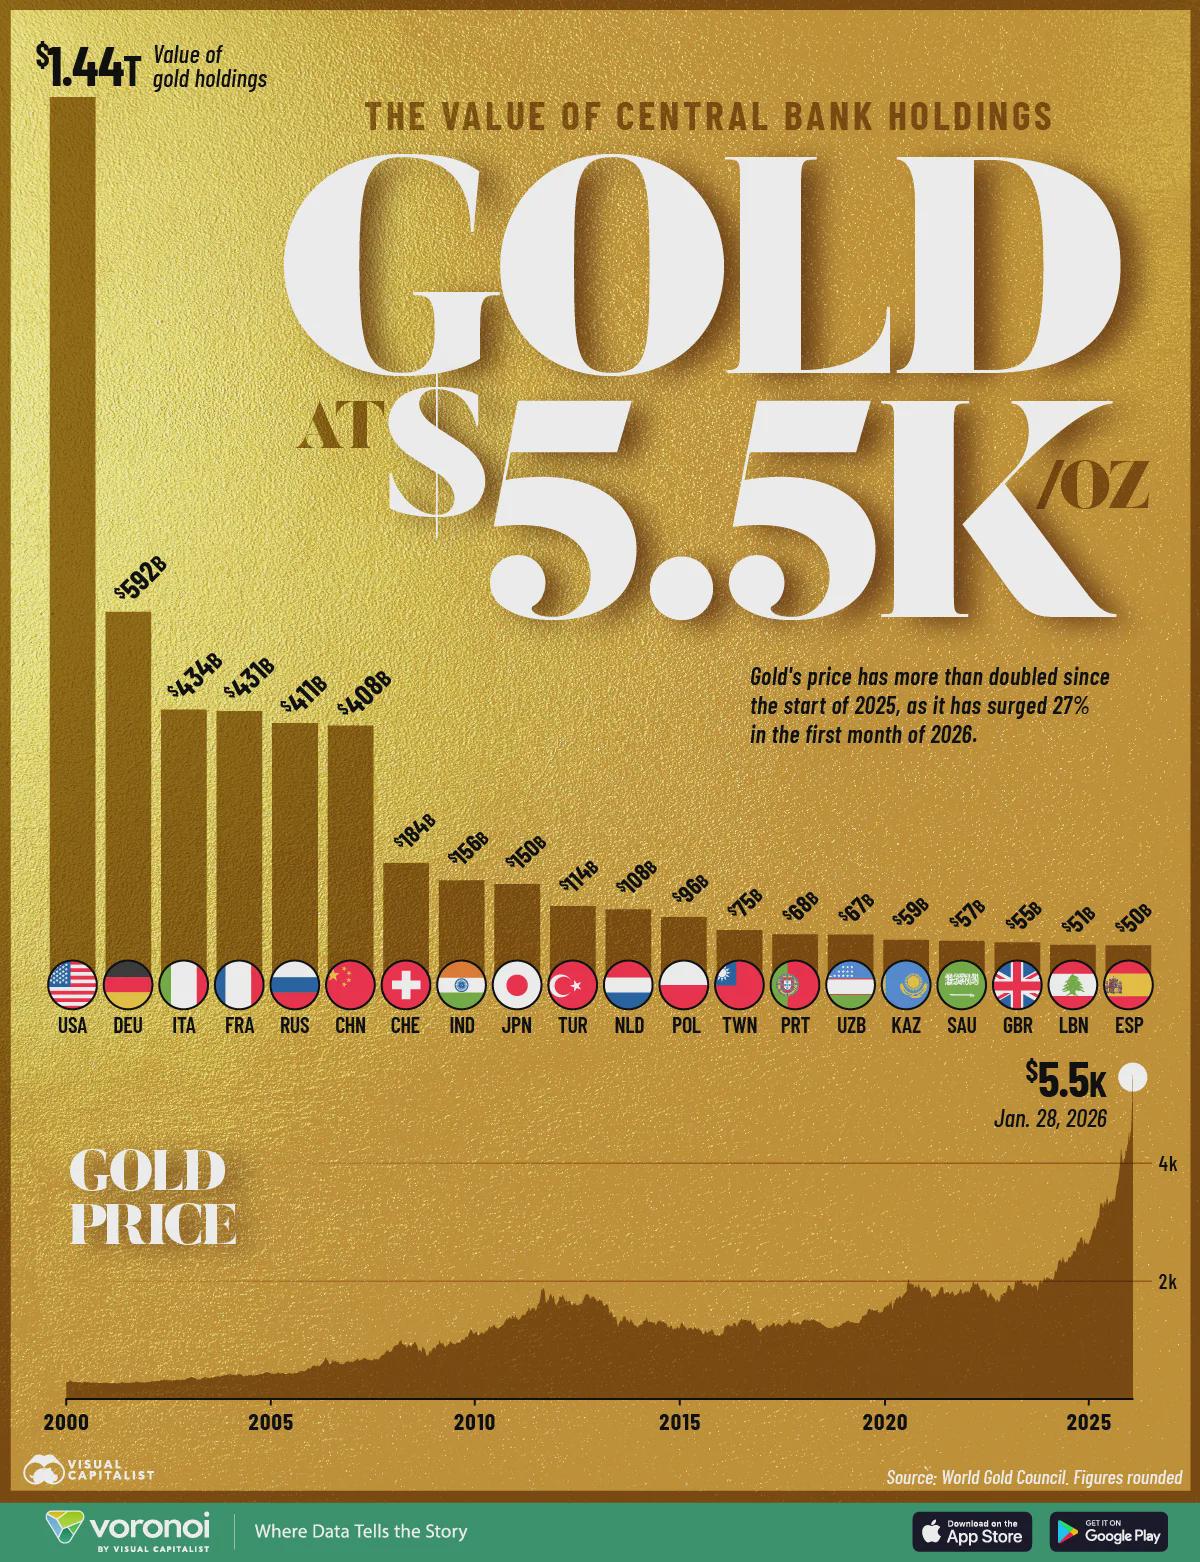
Ranked: Central Banks by the Value of Their Gold at $5,500 an Ounce Visualization
This data visualization displays "Ranked: Central Banks by the Value of Their Gold at $5,500 an Ounce" and provides a cl...
![[OC] I simulated Matchday 8 of the Champions League 20,000 times. Here is the probability distribution of the final League Phase standings. Visualization [OC] I simulated Matchday 8 of the Champions League 20,000 times. Here is the probability distribution of the final League Phase standings. Visualization](/api/images/reddit-maps/1qoqz7o_1769565602509.jpg)
[OC] I simulated Matchday 8 of the Champions League 20,000 times. Here is the probability distribution of the final League Phase standings. Visualization
This data visualization displays "[OC] I simulated Matchday 8 of the Champions League 20,000 times. Here is the probabil...
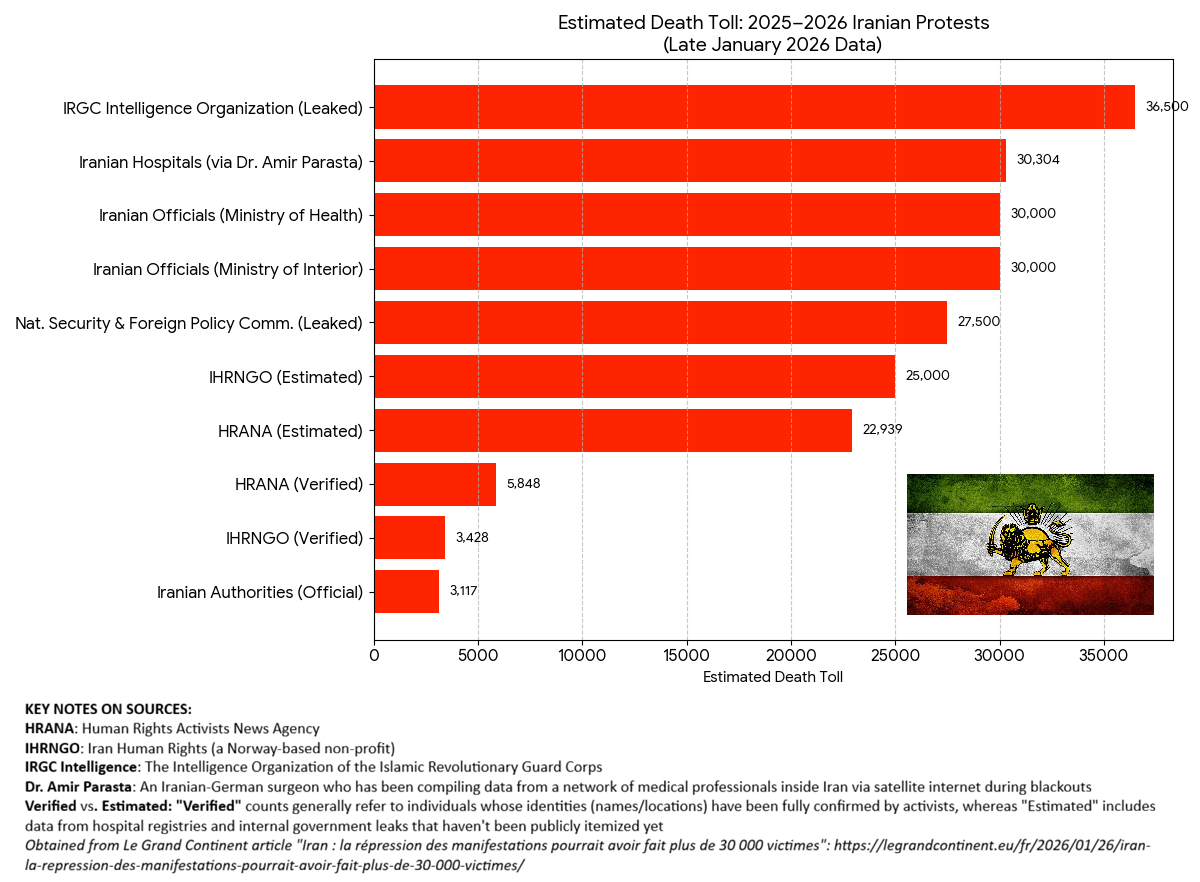
Estimated Death Toll of the 2025–2026 Iranian Protests Visualization
This data visualization displays "Estimated Death Toll of the 2025–2026 Iranian Protests" and provides a clear visual re...
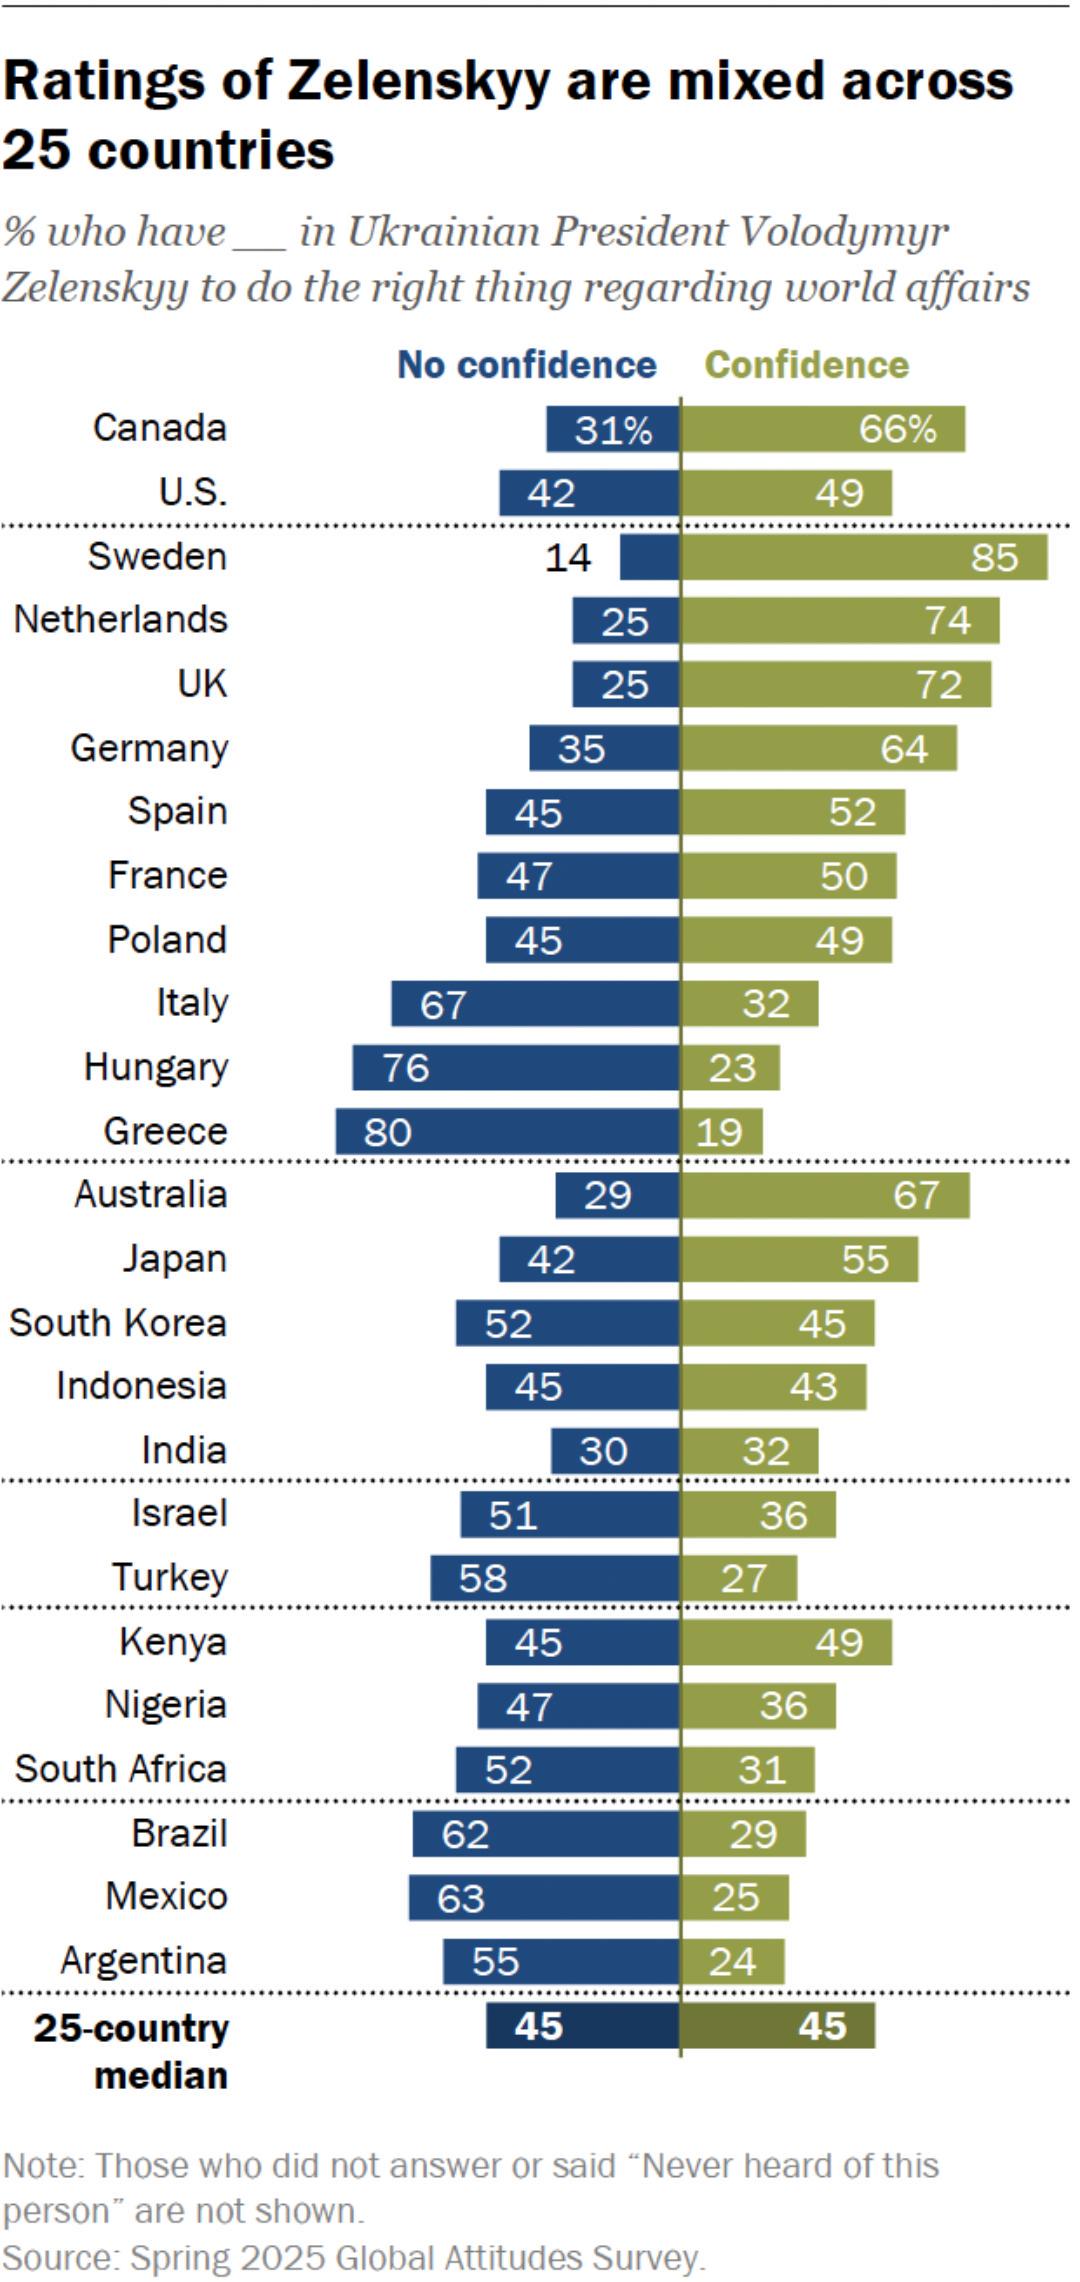
Ratings of Zelensky across different countries Visualization
This data visualization displays "Ratings of Zelensky across different countries" and provides a clear visual representa...
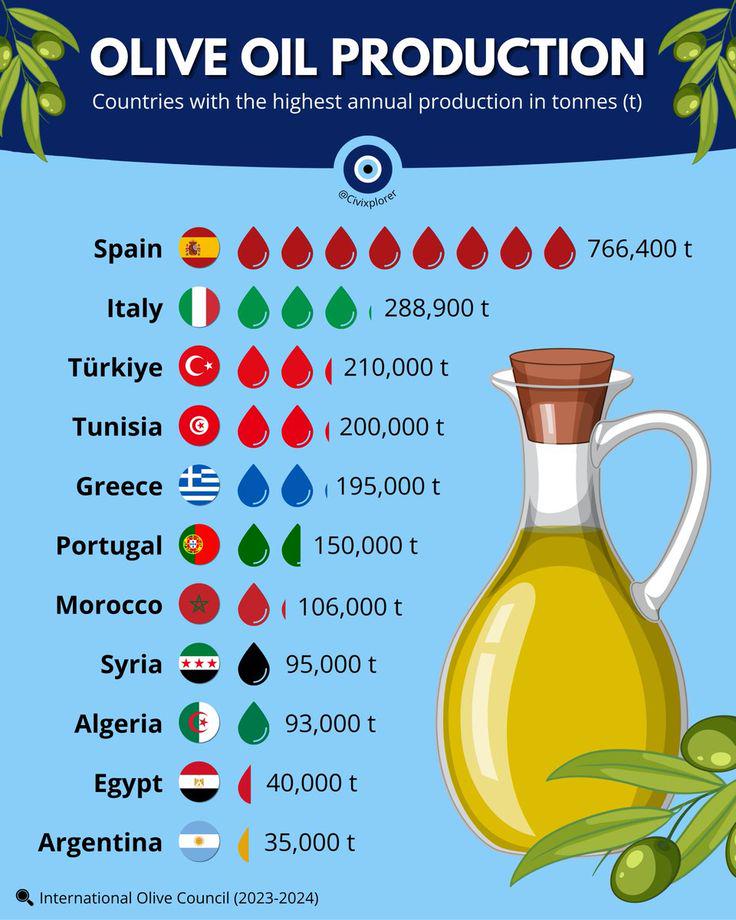
Olive Oil Production by countries Visualization
This data visualization displays "Olive Oil Production by countries" and provides a clear visual representation of the u...
![[OC] Made this visualization of median income to median home price. Visualization [OC] Made this visualization of median income to median home price. Visualization](/api/images/reddit-maps/1qsrmyo_1769940001090.jpg)
[OC] Made this visualization of median income to median home price. Visualization
This data visualization displays "[OC] Made this visualization of median income to median home price." and provides a cl...
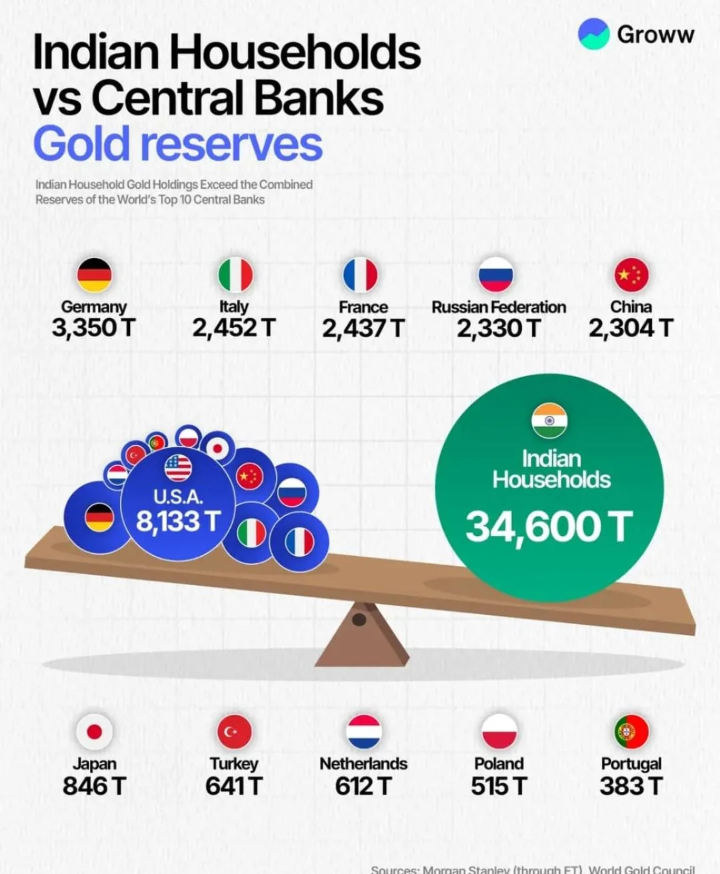
Gold reserves with each country Visualization
This data visualization displays "Gold reserves with each country" and provides a clear visual representation of the und...
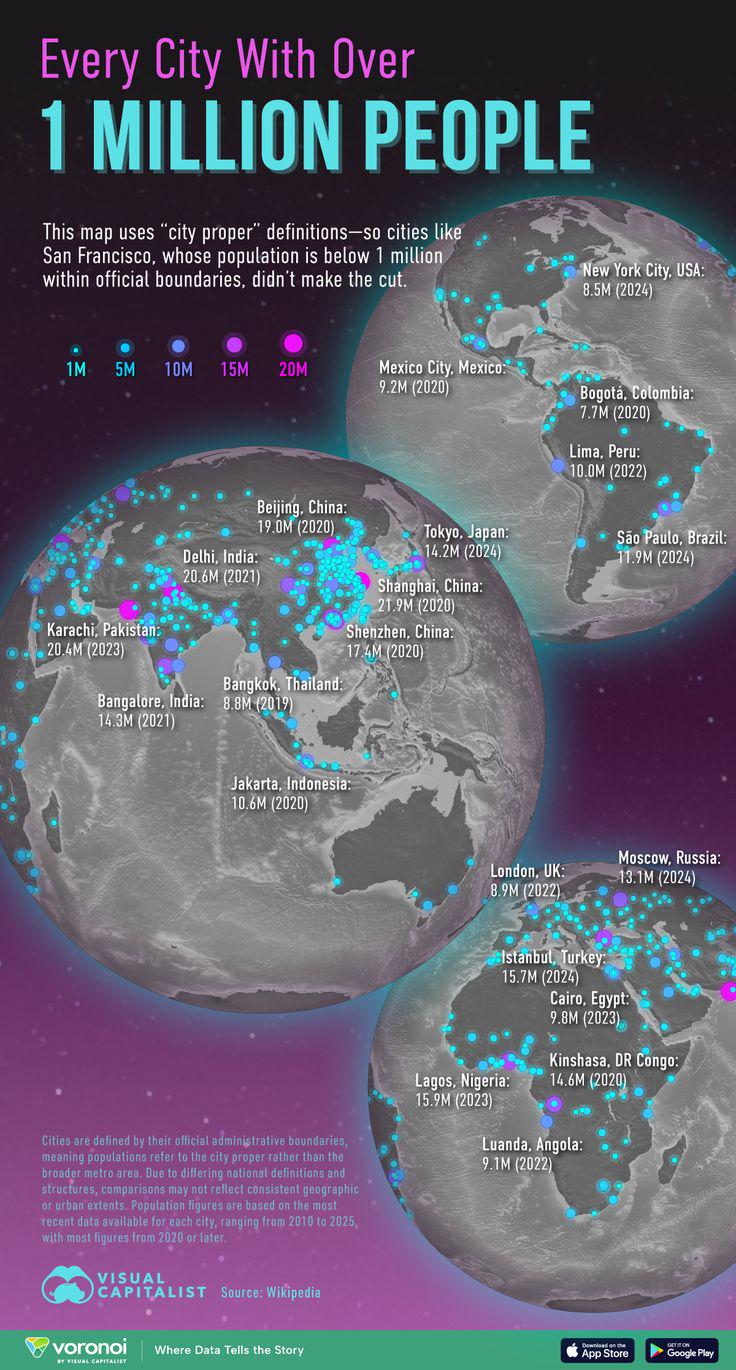
Every City With Over 1 Million People Visualization
This data visualization displays "Every City With Over 1 Million People" and provides a clear visual representation of t...
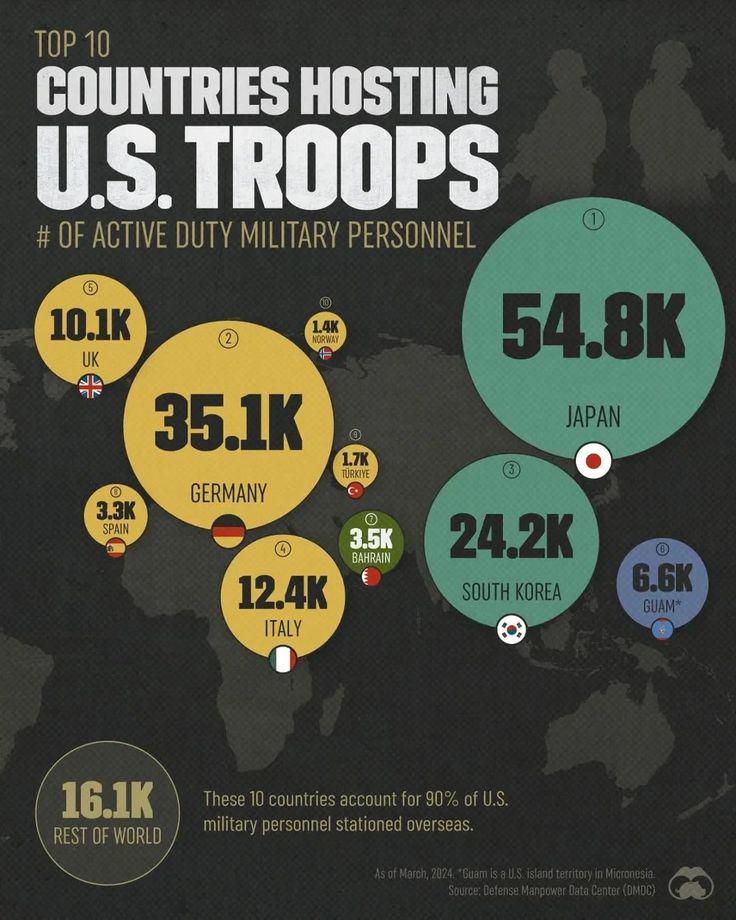
Top 10 Countries Hosting US Troops Visualization
This data visualization displays "Top 10 Countries Hosting US Troops" and provides a clear visual representation of the ...
![[OC] XKCD 2014 reprise - Roman Space Telescope launch timeline Visualization [OC] XKCD 2014 reprise - Roman Space Telescope launch timeline Visualization](/api/images/reddit-maps/1qmx1my_1769385601938.jpg)
[OC] XKCD 2014 reprise - Roman Space Telescope launch timeline Visualization
This data visualization displays "[OC] XKCD 2014 reprise - Roman Space Telescope launch timeline" and provides a clear v...
![My expenses and income in 2025 (Brazil) [OC] Visualization My expenses and income in 2025 (Brazil) [OC] Visualization](/api/images/reddit-maps/1qtyk6l_1770055203676.jpg)
My expenses and income in 2025 (Brazil) [OC] Visualization
This data visualization displays "My expenses and income in 2025 (Brazil) [OC]" and provides a clear visual representati...
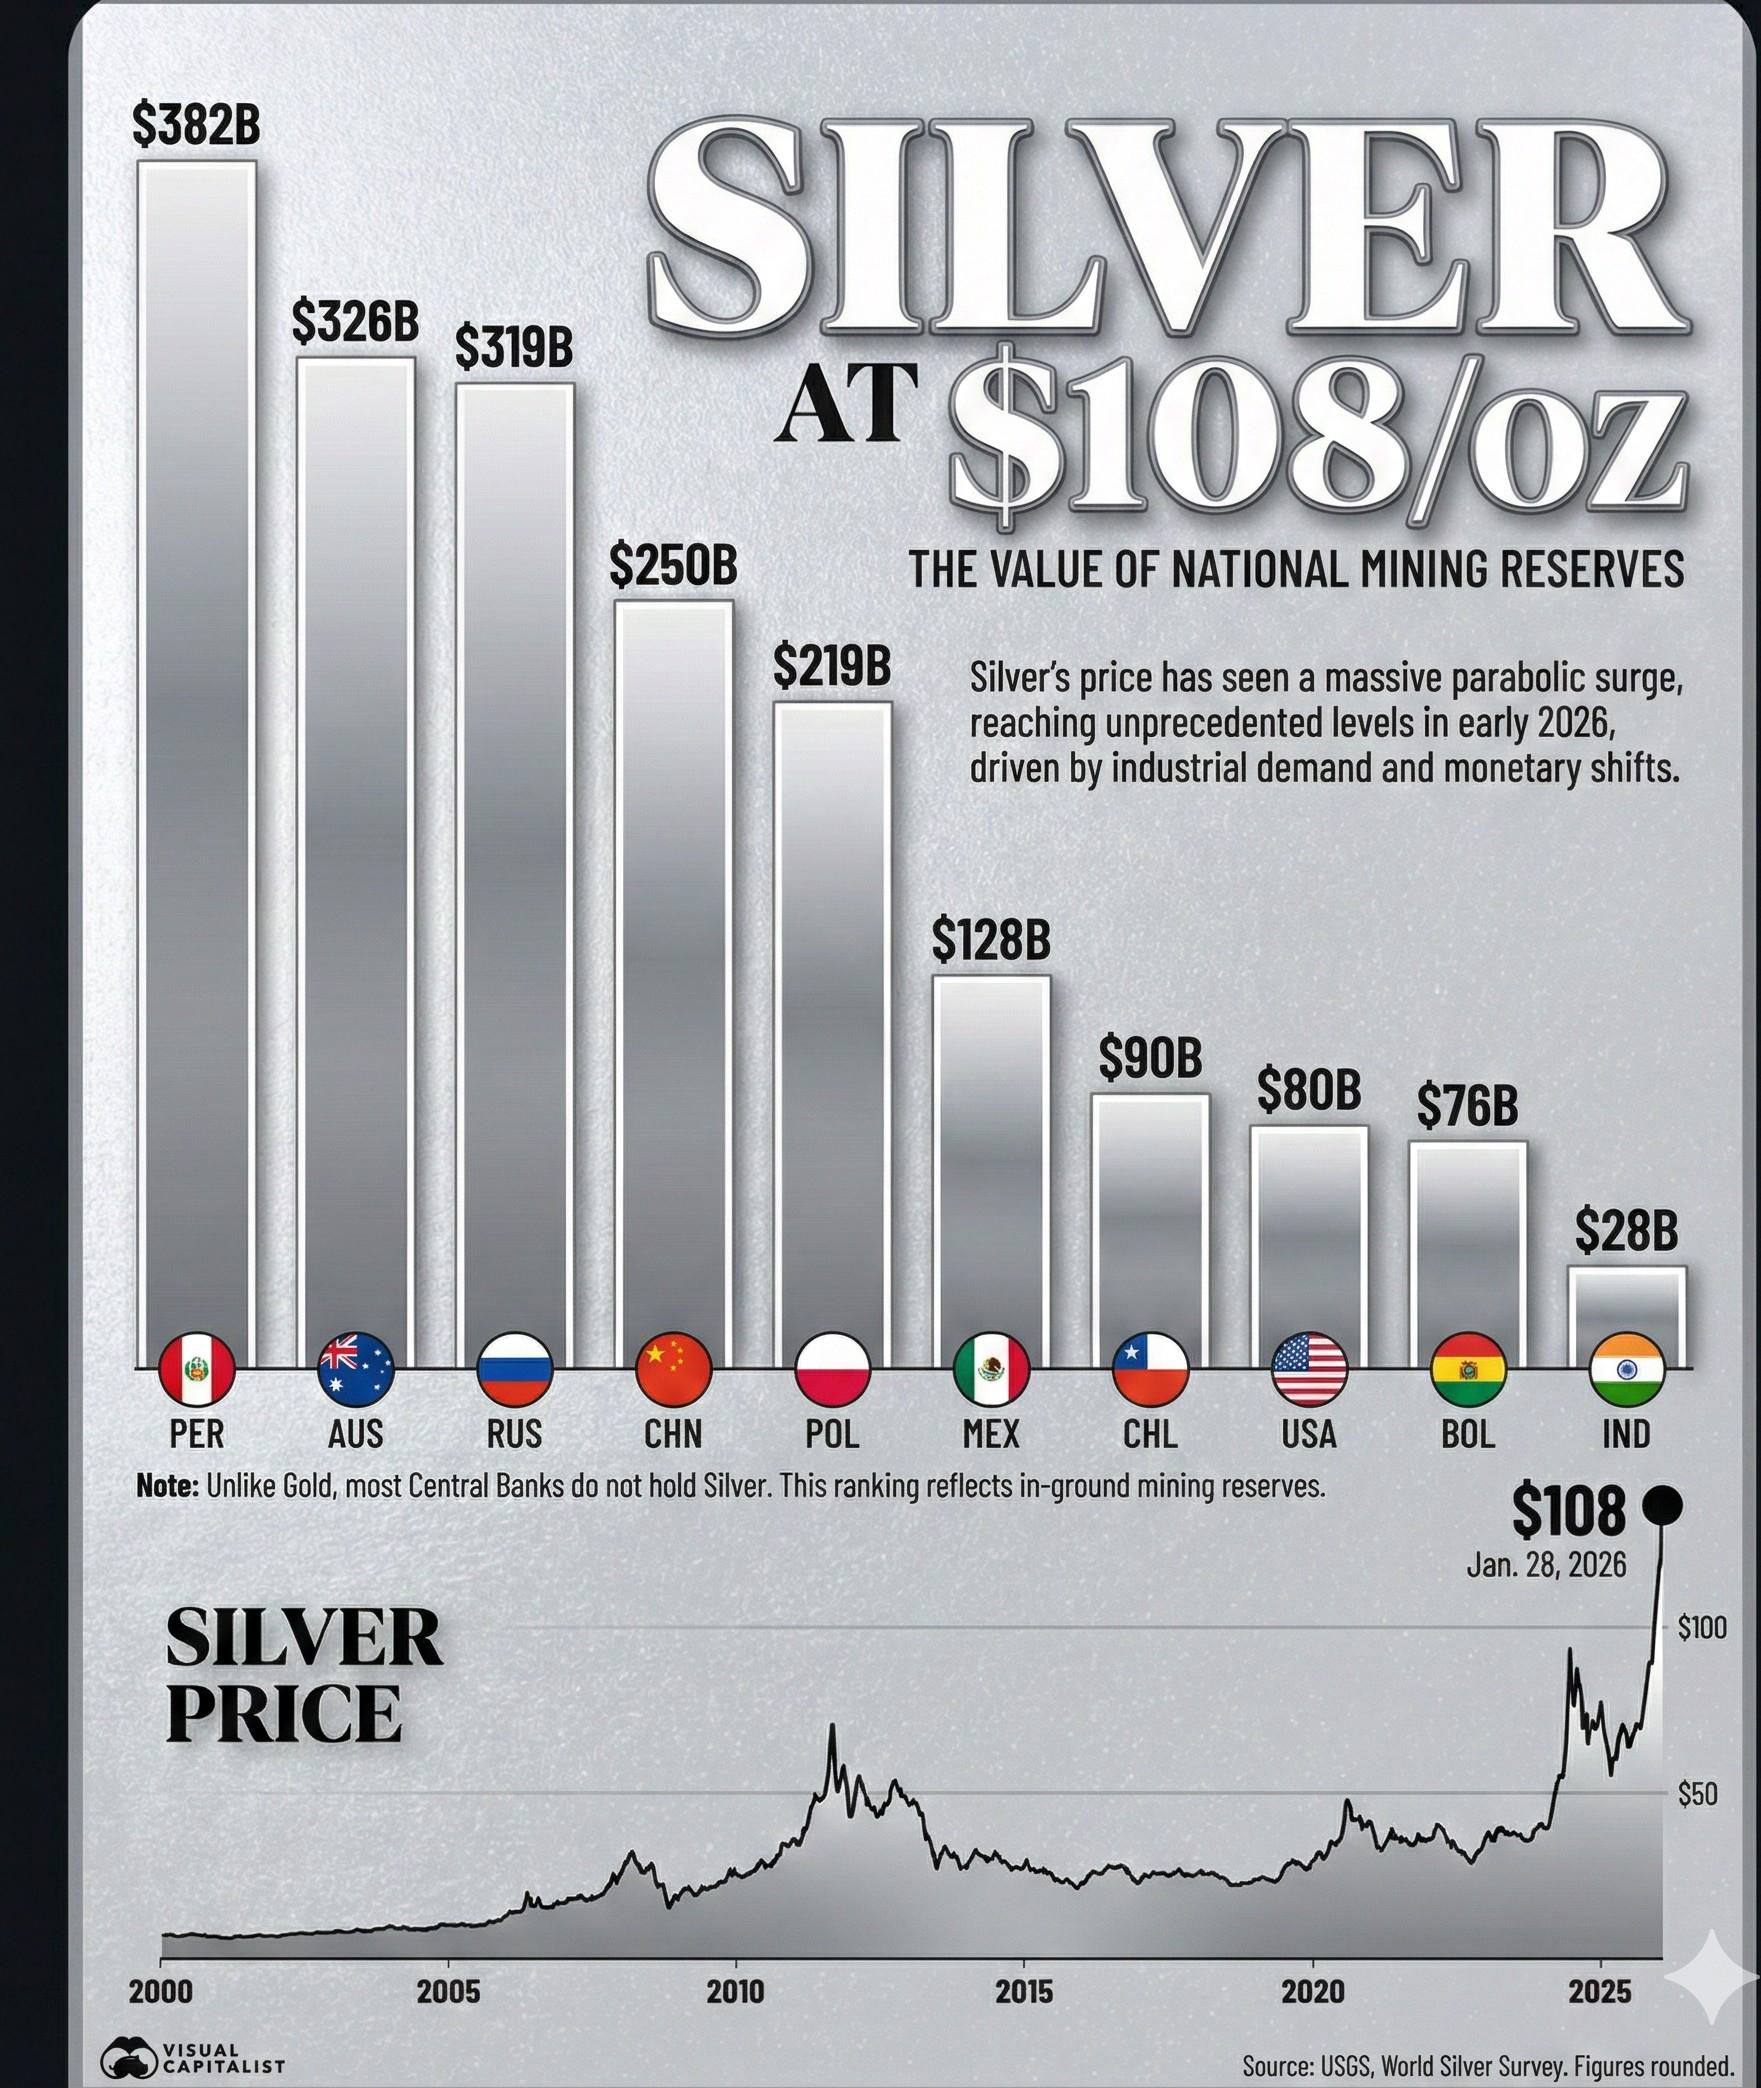
Ranked: Nations by the value of their Silver reserves at $108 and ounce Visualization
This data visualization displays "Ranked: Nations by the value of their Silver reserves at $108 and ounce" and provides ...
![[OC] My Expected Weight Using CICO During a Diet was Astoundingly Accurate Visualization [OC] My Expected Weight Using CICO During a Diet was Astoundingly Accurate Visualization](/api/images/reddit-maps/1qkgxjb_1769148001934.jpg)
[OC] My Expected Weight Using CICO During a Diet was Astoundingly Accurate Visualization
This data visualization displays "[OC] My Expected Weight Using CICO During a Diet was Astoundingly Accurate" and provid...
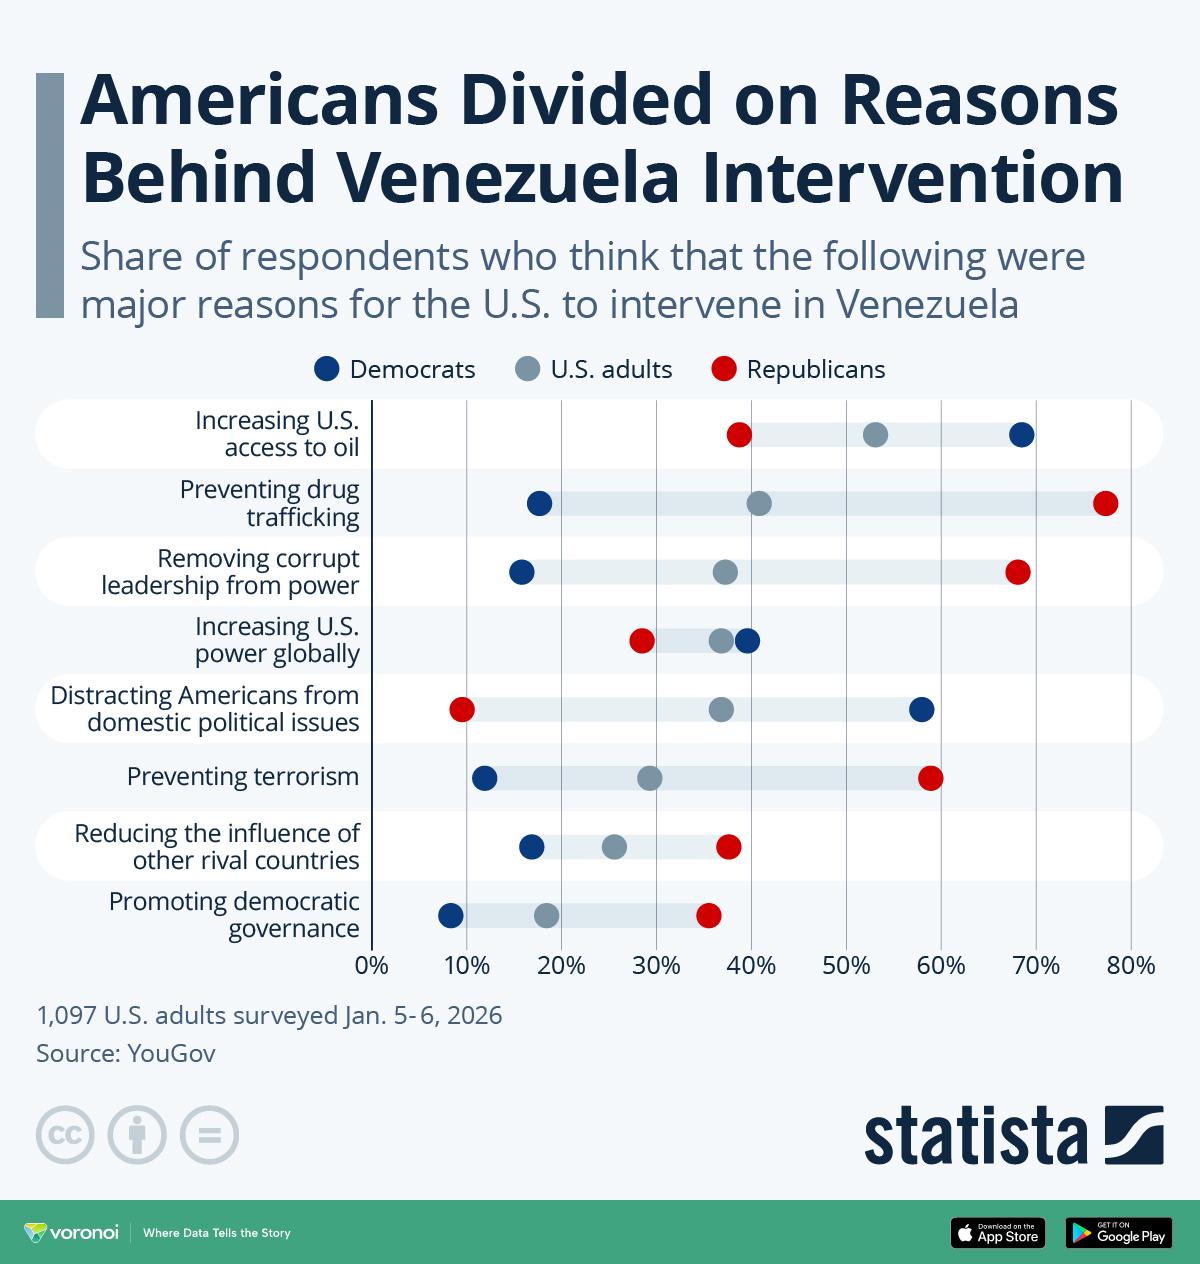
Americans Divided on Reasons Behind Venezuela Intervention Visualization
This data visualization displays "Americans Divided on Reasons Behind Venezuela Intervention" and provides a clear visua...
![[OC] 33% of UK Council CEOs made more than the Prime Minister in 2023-2024, the highest of which made more than £284,000 (~$386,000, just 14k shy of the US President.) Visualization [OC] 33% of UK Council CEOs made more than the Prime Minister in 2023-2024, the highest of which made more than £284,000 (~$386,000, just 14k shy of the US President.) Visualization](/api/images/reddit-maps/1qkx6vb_1769220001235.jpg)
[OC] 33% of UK Council CEOs made more than the Prime Minister in 2023-2024, the highest of which made more than £284,000 (~$386,000, just 14k shy of the US President.) Visualization
This data visualization displays "[OC] 33% of UK Council CEOs made more than the Prime Minister in 2023-2024, the highes...
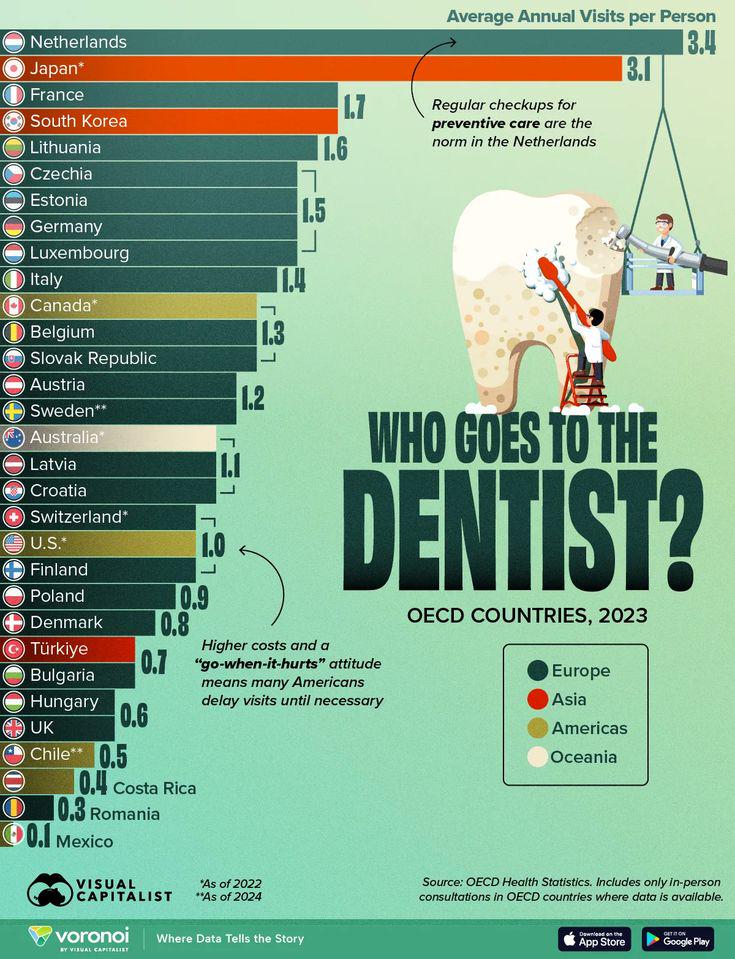
Annual Dentist Visits per Capita (OECD Countries) Visualization
This data visualization displays "Annual Dentist Visits per Capita (OECD Countries)" and provides a clear visual represe...
![[OC]A Land Cover Map🗺️of the Contiguous United States For the year 2000 Visualization [OC]A Land Cover Map🗺️of the Contiguous United States For the year 2000 Visualization](/api/images/reddit-maps/1qhd9ms_1768860005909.jpg)
[OC]A Land Cover Map🗺️of the Contiguous United States For the year 2000 Visualization
This data visualization displays "[OC]A Land Cover Map🗺️of the Contiguous United States For the year 2000" and provides...