Guyana’s Economic Shift Amidst Regional Tensions Visualization
Data Analysis
What This Visualization Shows
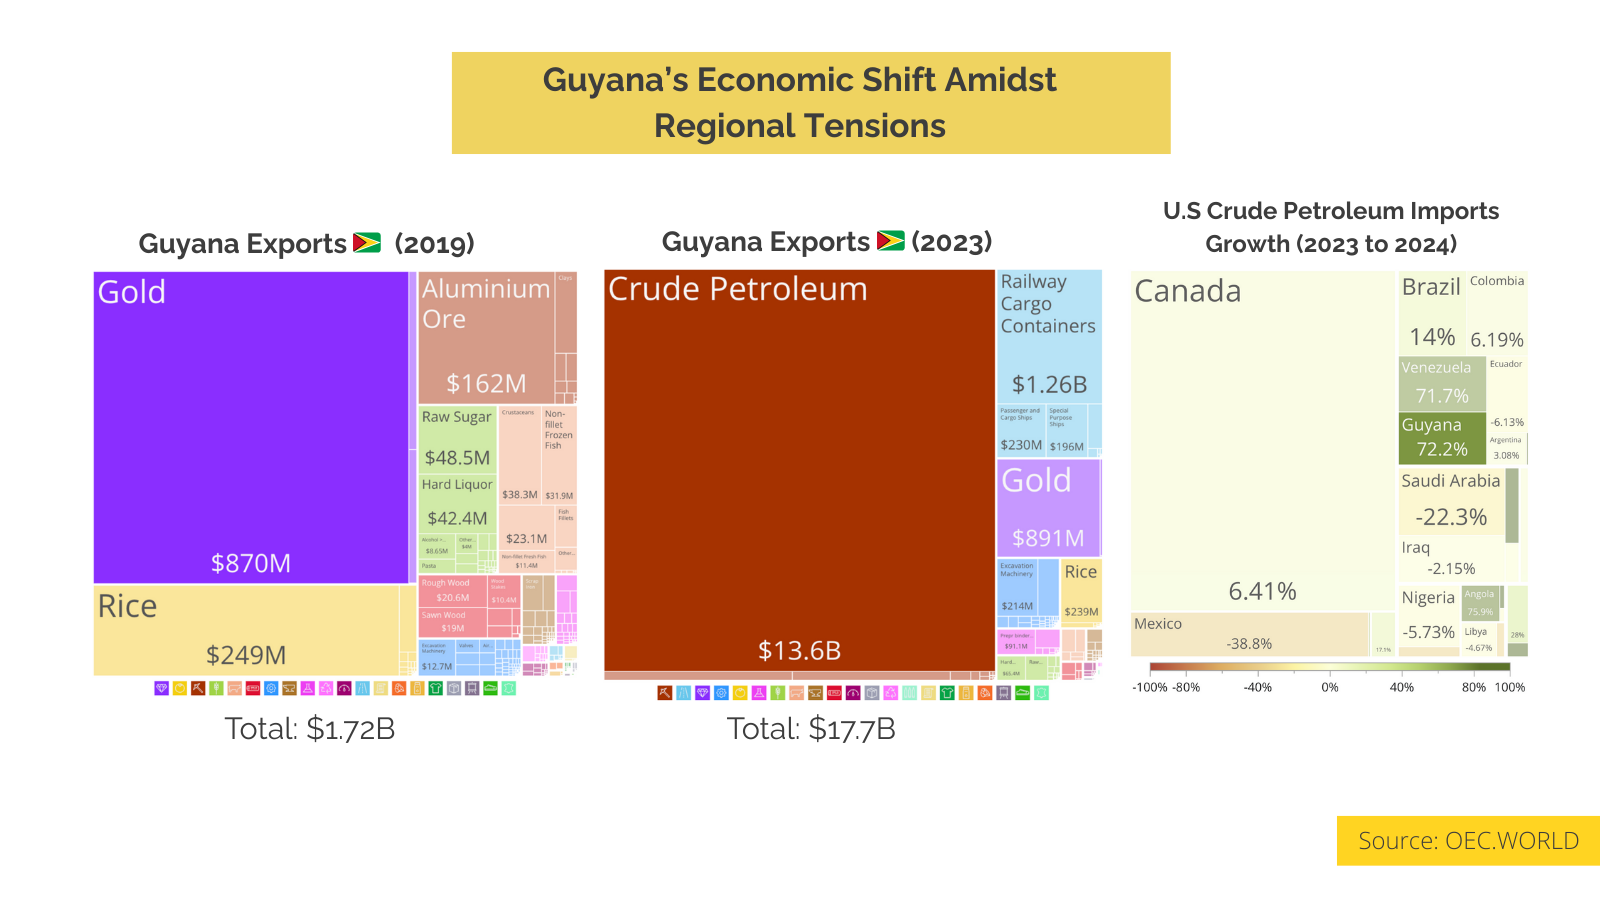
This data visualization displays "Guyana’s Economic Shift Amidst Regional Tensions" and provides a clear visual representation of the underlying data patterns and trends. The visualization focuses on Tensions regarding Venezuela's claim to the Essequibo region have shifted following US strategic interventions in early 2026. While the political narrative has been widely covered, trade data offers a complete context of the economic players.
While Venezuela’s output has struggled, Guyana has surged to become a significant energy partner for the United States. As of late 2025, Guyana ranked among the top 5 sources of US net crude oil imports, joining major suppliers such as Canada, Mexico, and Saudi Arabia, and showing one of the most significant growths.
However, it is important to keep the scale in perspective. Canada remains the undisputed giant of US energy security, supplying over 60% of US crude petroleum imports. Even though Guyana is far from competing with Canada, it could become a critical diversification pivot for the US.
The most striking data point is the speed of Guyana's economic overhaul. In 2019, the country’s primary exports were Gold, Rice, and Aluminum Ore. Today, those sectors have been completely eclipsed by the oil boom. What once was an agrarian and mining-based economy is now the second-largest oil exporter in South America, with oil accounting for over 75% of its total exports.
This rapid growth is explained by significant Western investment. Ownership of the consortium controlling Guyana’s oil output is split between three partners, with American companies (ExxonMobil and Chevron) holding a combined majority stake of 75%. *(*[*Journal of Petroleum Technology*](https://jpt.spe.org/chevron-closes-hess-deal-exxonmobil-welcomes-new-partner-offshore-guyana#:~:text=The%20deal%20cleared%20its%20final,not%20just%20asset%2Dlevel%20transactions.)*)*
The trade data confirms that Guyana’s economy has pivoted sharply toward Western markets, with the vast majority of its new oil exports destined for the United States and the Netherlands.
**Trade Data**
US: [https://oec.world/en/profile/country/usa?selector335id=HS4&selector303id=Year&selector320id=1&selector322id=growth&selector1878id=percentage](https://oec.world/en/profile/country/usa?selector335id=HS4&selector303id=Year&selector320id=1&selector322id=growth&selector1878id=percentage)
Guyana: [https://oec.world/en/profile/country/guy](https://oec.world/en/profile/country/guy), which allows us to understand complex relationships and insights within the data through visual storytelling.
Deep Dive into the Topic
Economic data visualization plays a crucial role in understanding market trends, financial performance, and economic patterns across different sectors and regions. This type of data analysis helps economists, policymakers, and business leaders make informed decisions based on quantitative insights.
Economic indicators such as GDP growth, unemployment rates, inflation, and market performance are complex datasets that require sophisticated visualization techniques to communicate effectively. Interactive charts and graphs can reveal trends over time, compare performance across different markets, and highlight correlations between various economic factors.
The significance of economic data visualization extends beyond academic research. Financial institutions use these visualizations for risk assessment, investment strategies, and market analysis. Governments rely on economic data visualization to track policy effectiveness, plan budgets, and communicate economic status to citizens. Businesses use economic trend analysis to forecast demand, plan expansion, and assess market opportunities.
Data Analysis and Insights
The patterns revealed in this visualization demonstrate the importance of systematic data analysis in understanding complex phenomena. By examining different data segments, time periods, and categorical breakdowns, we can identify trends that inform strategic planning and decision-making processes.
Statistical analysis of this data reveals variations across different dimensions that provide insights into underlying drivers and relationships. These patterns help identify areas of opportunity, potential risks, and key performance indicators that can guide future actions and resource allocation.
The analytical approach used in this visualization enables comparison across different categories, time periods, or geographic regions, revealing insights that support evidence-based decision-making. This type of analysis is essential for organizations seeking to optimize performance and understand complex market dynamics.
Significance and Applications
This data visualization has important implications for understanding trends and patterns that affect decision-making across multiple sectors. The insights derived from this analysis can inform policy development, business strategy, resource allocation, and operational improvements.
For analysts, researchers, and decision-makers, this type of data visualization provides essential insights for strategic planning and performance optimization. Whether addressing operational challenges, market analysis, or policy development, understanding data patterns helps create more effective strategies and solutions.
The broader significance lies in how this information contributes to our understanding of complex systems and relationships. This knowledge helps predict future trends, identify potential challenges, and develop more informed approaches to problem-solving and opportunity identification.
Comments
Loading comments...
Leave a Comment
About the Author

Alex Cartwright
Senior Data Visualization Expert
Alex Cartwright is a renowned data visualization specialist and infographic designer with over 15 years of experience in...