Why is China the world's largest exporter of Memory Circuits, but also the largest importer from Korea? Visualization
Data Analysis
What This Visualization Shows
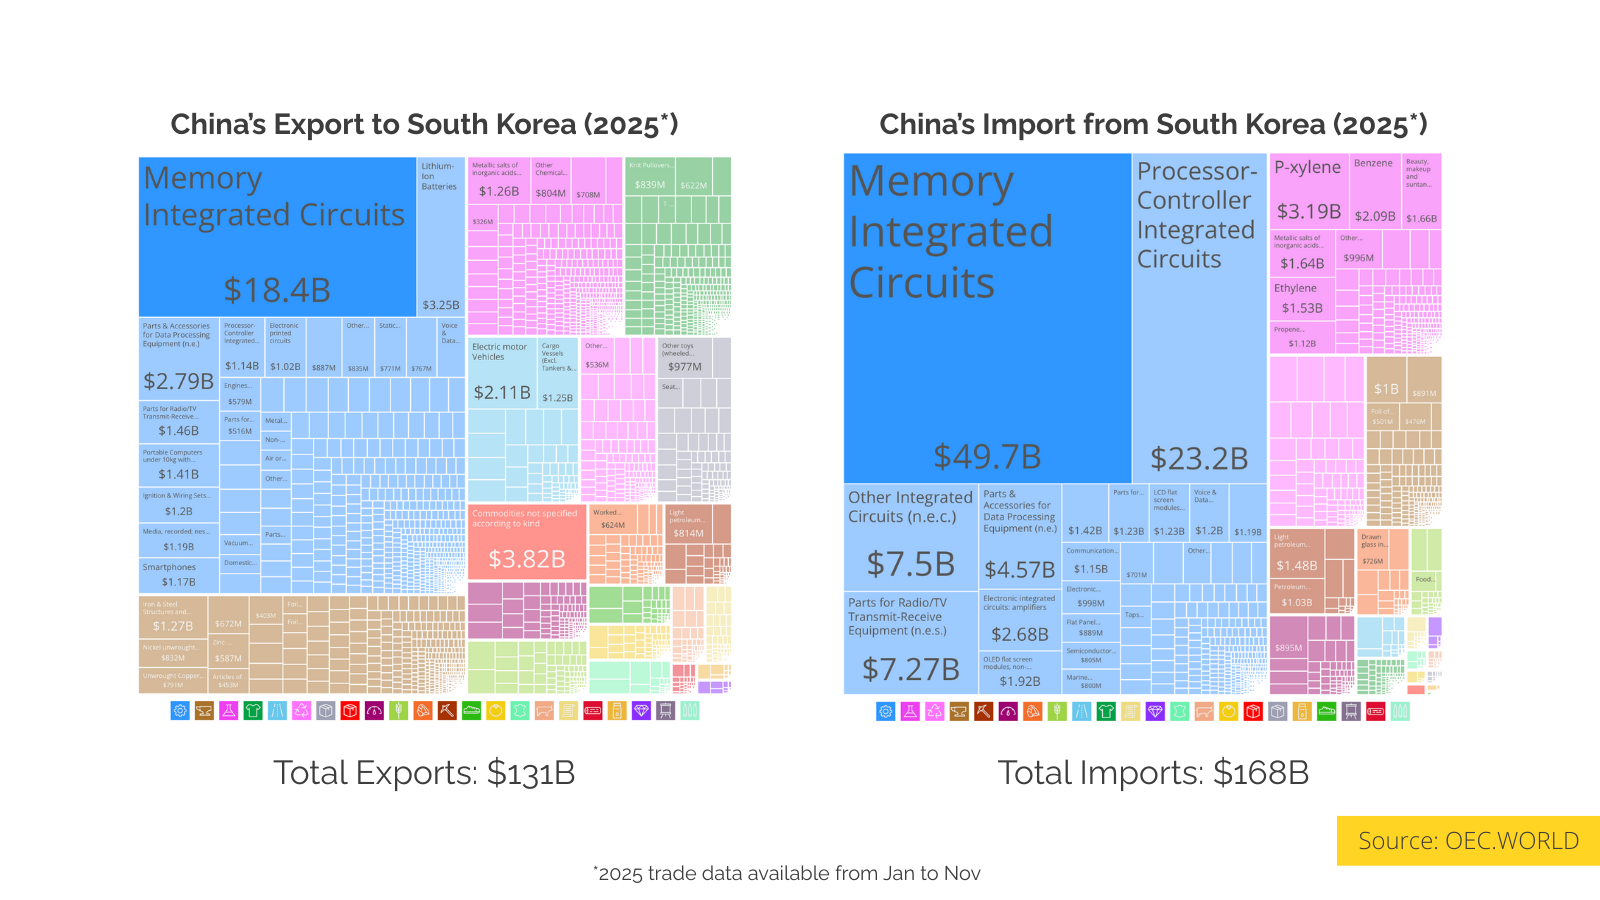
This data visualization displays "Why is China the world's largest exporter of Memory Circuits, but also the largest importer from Korea?" and provides a clear visual representation of the underlying data patterns and trends. The visualization focuses on While it might initially appear redundant for two major manufacturing nations to trade such high volumes of the same category, a closer look at market dynamics suggests this is actually a case of distinct technological specialization rather than simple competition.
From January to November 2025, China imported more than $99 billion in Memory Integrated Circuits. South Korea held the dominant position in this inflow, accounting for nearly 50% of the total import share and registering a growth of $8.6 billion compared to the same period in the previous year. Conversely, South Korea also became the primary export destination for Chinese Memory Integrated Circuits during this window, with over $18 billion of product landing in the Korean market.
The core of this exchange appears to be driven by the diverging requirements of consumer electronics versus artificial intelligence infrastructure. While the trade classification is identical, the actual hardware differs substantially. South Korea, through major firms like Samsung and SK Hynix, has largely pivoted towards High Bandwidth Memory (HBM). This advanced memory is essential for AI data centers, which has led to a shift in global production lines. As these manufacturers concentrate on the high-margin HBM sector to meet the demands of generative AI, a supply gap has emerged for standard memory units.
China has moved to fill this gap in the legacy market. The data indicates that China has consolidated its position as a primary exporter of standard DDR3 and DDR4 chips, the components still required for everyday laptops, mobile devices, and consumer electronics. Consequently, the high export volume from China represents these "workhorse" chips flowing out to markets that traditional leaders are prioritizing less.
In contrast, China’s massive import volume from South Korea tells a different story. Despite being a manufacturing powerhouse, China currently relies on imports for the advanced HBM architecture needed for AI development. The increased import value observed from 2024 onwards suggests a strategy of securing supply. Facing potential price volatility and the possibility of future trade restrictions, Chinese entities appear to be engaging in strategic stockpiling of these advanced components to ensure their data center infrastructure remains robust.
Ultimately, the data reflects a complex, symbiotic relationship. China is effectively stabilizing the global market for consumer-grade memory, while simultaneously directing significant capital into South Korea to secure the high-end silicon necessary for the ongoing AI transition.
Trade data source: [https://oec.world/en/profile/country/chn](https://oec.world/en/profile/country/chn), which allows us to understand complex relationships and insights within the data through visual storytelling.
Deep Dive into the Topic
This data visualization represents a sophisticated analysis of complex information patterns that provide valuable insights into underlying trends and relationships. Data visualization serves as a bridge between raw numerical data and human understanding, transforming abstract statistics into comprehensible visual narratives.
The power of data visualization lies in its ability to reveal patterns, outliers, and correlations that might not be apparent in traditional tabular formats. Through careful selection of chart types, color schemes, and interactive elements, effective visualizations can communicate complex information quickly and accurately to diverse audiences.
Modern data visualization combines statistical analysis with design principles to create compelling visual stories. This interdisciplinary approach requires understanding both the underlying data and the cognitive processes involved in visual perception. The result is more effective communication of quantitative insights that can inform decision-making and drive positive change.
Data Analysis and Insights
The patterns revealed in this visualization demonstrate the importance of systematic data analysis in understanding complex phenomena. By examining different data segments, time periods, and categorical breakdowns, we can identify trends that inform strategic planning and decision-making processes.
Statistical analysis of this data reveals variations across different dimensions that provide insights into underlying drivers and relationships. These patterns help identify areas of opportunity, potential risks, and key performance indicators that can guide future actions and resource allocation.
The analytical approach used in this visualization enables comparison across different categories, time periods, or geographic regions, revealing insights that support evidence-based decision-making. This type of analysis is essential for organizations seeking to optimize performance and understand complex market dynamics.
Significance and Applications
This data visualization has important implications for understanding trends and patterns that affect decision-making across multiple sectors. The insights derived from this analysis can inform policy development, business strategy, resource allocation, and operational improvements.
For analysts, researchers, and decision-makers, this type of data visualization provides essential insights for strategic planning and performance optimization. Whether addressing operational challenges, market analysis, or policy development, understanding data patterns helps create more effective strategies and solutions.
The broader significance lies in how this information contributes to our understanding of complex systems and relationships. This knowledge helps predict future trends, identify potential challenges, and develop more informed approaches to problem-solving and opportunity identification.
Comments
Loading comments...
Leave a Comment
About the Author

Alex Cartwright
Senior Data Visualization Expert
Alex Cartwright is a renowned data visualization specialist and infographic designer with over 15 years of experience in...