China’s electrical machinery exports hit a record $98.5B a month. Here’s how the pandemic permanently rewired global manufacturing. Visualization
Data Analysis
What This Visualization Shows
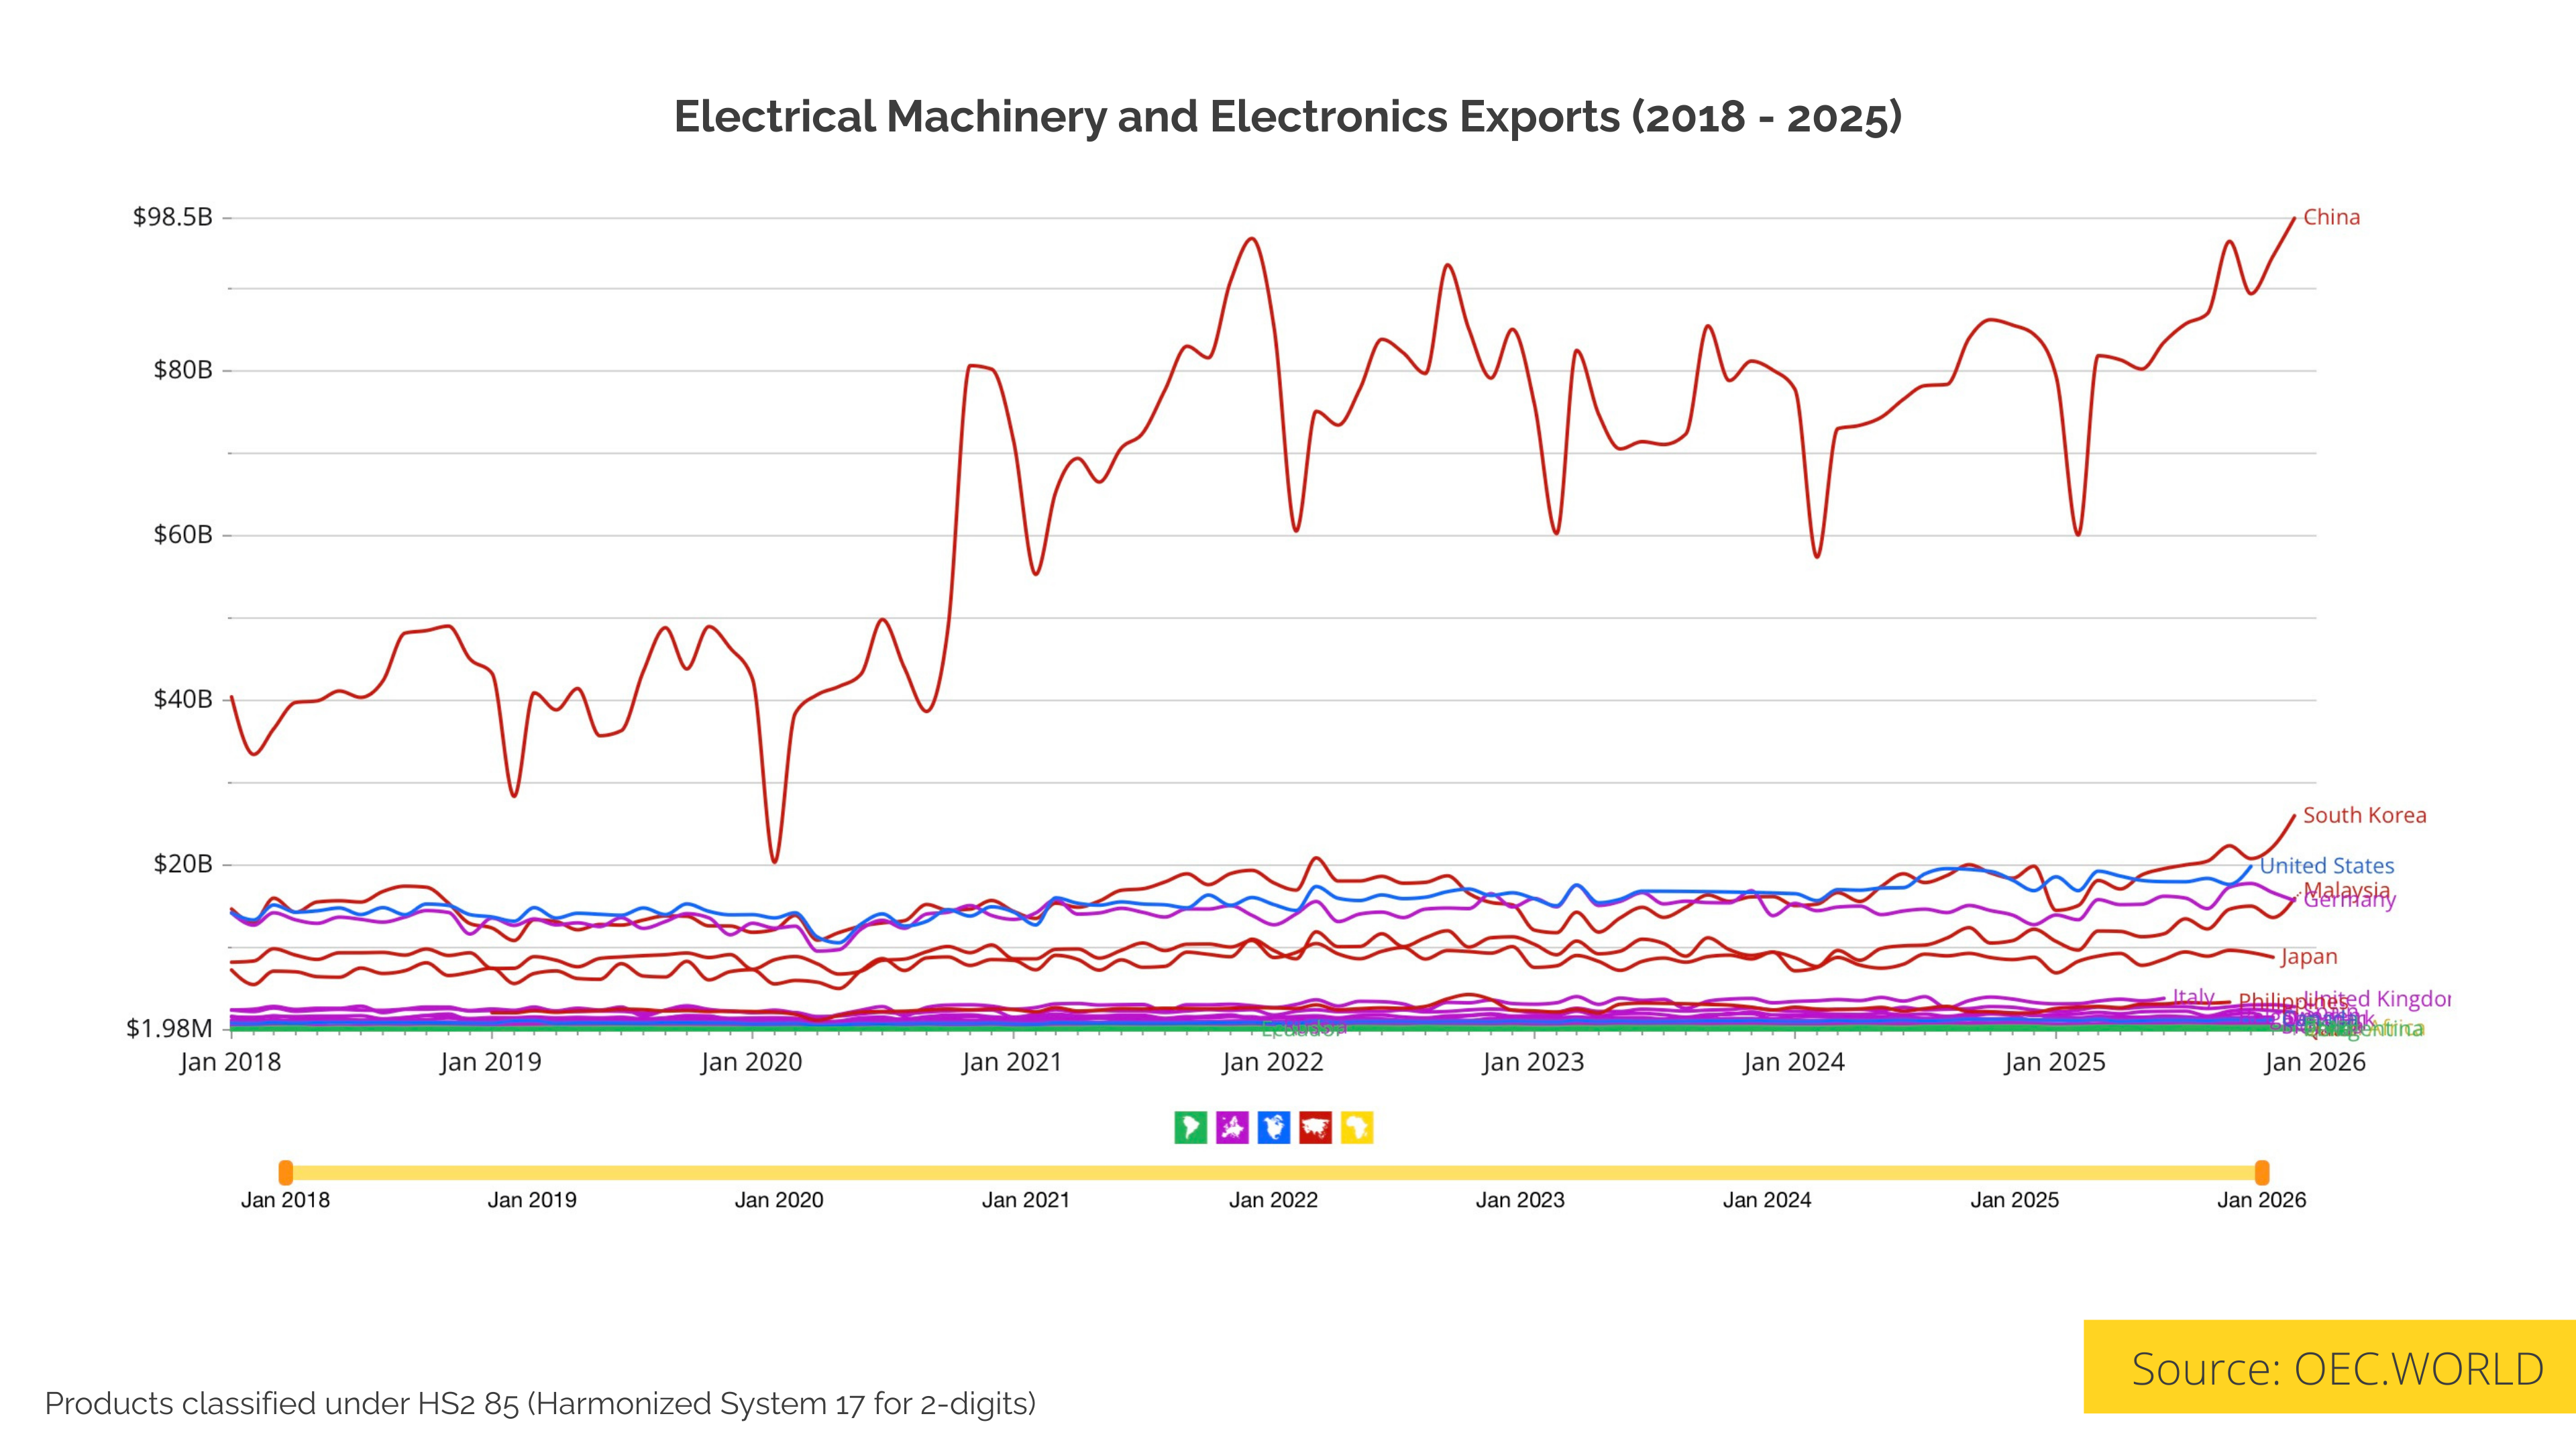
This data visualization displays "China’s electrical machinery exports hit a record $98.5B a month. Here’s how the pandemic permanently rewired global manufacturing." and provides a clear visual representation of the underlying data patterns and trends. The visualization focuses on South Korea, the United States, and Germany, three of the most heavily industrialized economies on the planet, right now export somewhere between $15 billion and $25 billion in electrical machinery per month. In Dec 2025, China reached a historic monthly export peak of $98.5B, widening a gap that has been steadily accelerating since 2021.
An almost vertical recovery for China followed the initial COVID shock in early 2020. By 2022, exports had blasted past the $90B/month mark, effectively doubling their pre-pandemic levels in less than two years, driven by western economies rapidly shifting toward remote work and bingeing on consumer electronics. China was the only player capable of meeting that massive surge with a structural leap in production.
There's also a long-term play here: vendor lock-in. Countries that buy Chinese electrical machinery inevitably become dependent on their replacement parts, their technical service, and eventually, their engineering standards. The implications are massive, but they vary wildly depending on where you look:
For developing economies this is actually fueling industrialization. Cheap yet increasingly sophisticated Chinese machinery is enabling countries across Southeast Asia, Africa, and Latin America to expand their manufacturing capacity rapidly. These upgrades would have been entirely unaffordable if they had to rely on traditional German or Japanese suppliers.
Established economic powerhouses (Germany, Japan, South Korea) are now facing intense, existential pressure from cheaper alternatives that are "good enough" (and rapidly getting better).
In the United States, the landscape is highly uncomfortable. The US still exports significant volumes of machinery, but the reality is shifting. As we saw with the recently signed US-Indonesia trade pact, American industrial exports increasingly require heavy political backing and leverage to stay competitive on the global stage.
It is impossible to deny China’s absolute dominance in electrical machinery, creating deep structural dependencies. Still, the real question is how the rest of the world will adapt to a future in which the gears of global industry are overwhelmingly stamped with “Made in China” at the bottom.
Source:[ https://oec.world/en/profile/hs/electrical-machinery-and-electronics](https://oec.world/es/profile/hs/electrical-machinery-and-electronics)
, which allows us to understand complex relationships and insights within the data through visual storytelling.
Deep Dive into the Topic
This data visualization represents a sophisticated analysis of complex information patterns that provide valuable insights into underlying trends and relationships. Data visualization serves as a bridge between raw numerical data and human understanding, transforming abstract statistics into comprehensible visual narratives.
The power of data visualization lies in its ability to reveal patterns, outliers, and correlations that might not be apparent in traditional tabular formats. Through careful selection of chart types, color schemes, and interactive elements, effective visualizations can communicate complex information quickly and accurately to diverse audiences.
Modern data visualization combines statistical analysis with design principles to create compelling visual stories. This interdisciplinary approach requires understanding both the underlying data and the cognitive processes involved in visual perception. The result is more effective communication of quantitative insights that can inform decision-making and drive positive change.
Data Analysis and Insights
The patterns revealed in this visualization demonstrate the importance of systematic data analysis in understanding complex phenomena. By examining different data segments, time periods, and categorical breakdowns, we can identify trends that inform strategic planning and decision-making processes.
Statistical analysis of this data reveals variations across different dimensions that provide insights into underlying drivers and relationships. These patterns help identify areas of opportunity, potential risks, and key performance indicators that can guide future actions and resource allocation.
The analytical approach used in this visualization enables comparison across different categories, time periods, or geographic regions, revealing insights that support evidence-based decision-making. This type of analysis is essential for organizations seeking to optimize performance and understand complex market dynamics.
Significance and Applications
This data visualization has important implications for understanding trends and patterns that affect decision-making across multiple sectors. The insights derived from this analysis can inform policy development, business strategy, resource allocation, and operational improvements.
For analysts, researchers, and decision-makers, this type of data visualization provides essential insights for strategic planning and performance optimization. Whether addressing operational challenges, market analysis, or policy development, understanding data patterns helps create more effective strategies and solutions.
The broader significance lies in how this information contributes to our understanding of complex systems and relationships. This knowledge helps predict future trends, identify potential challenges, and develop more informed approaches to problem-solving and opportunity identification.
Comments
Loading comments...
Leave a Comment
About the Author

Alex Cartwright
Senior Data Visualization Expert
Alex Cartwright is a renowned data visualization specialist and infographic designer with over 15 years of experience in...