The $140B global EV market is growing 43% per year as the Strait of Hormuz closes, and gas hits record prices. Visualization
Data Analysis
What This Visualization Shows
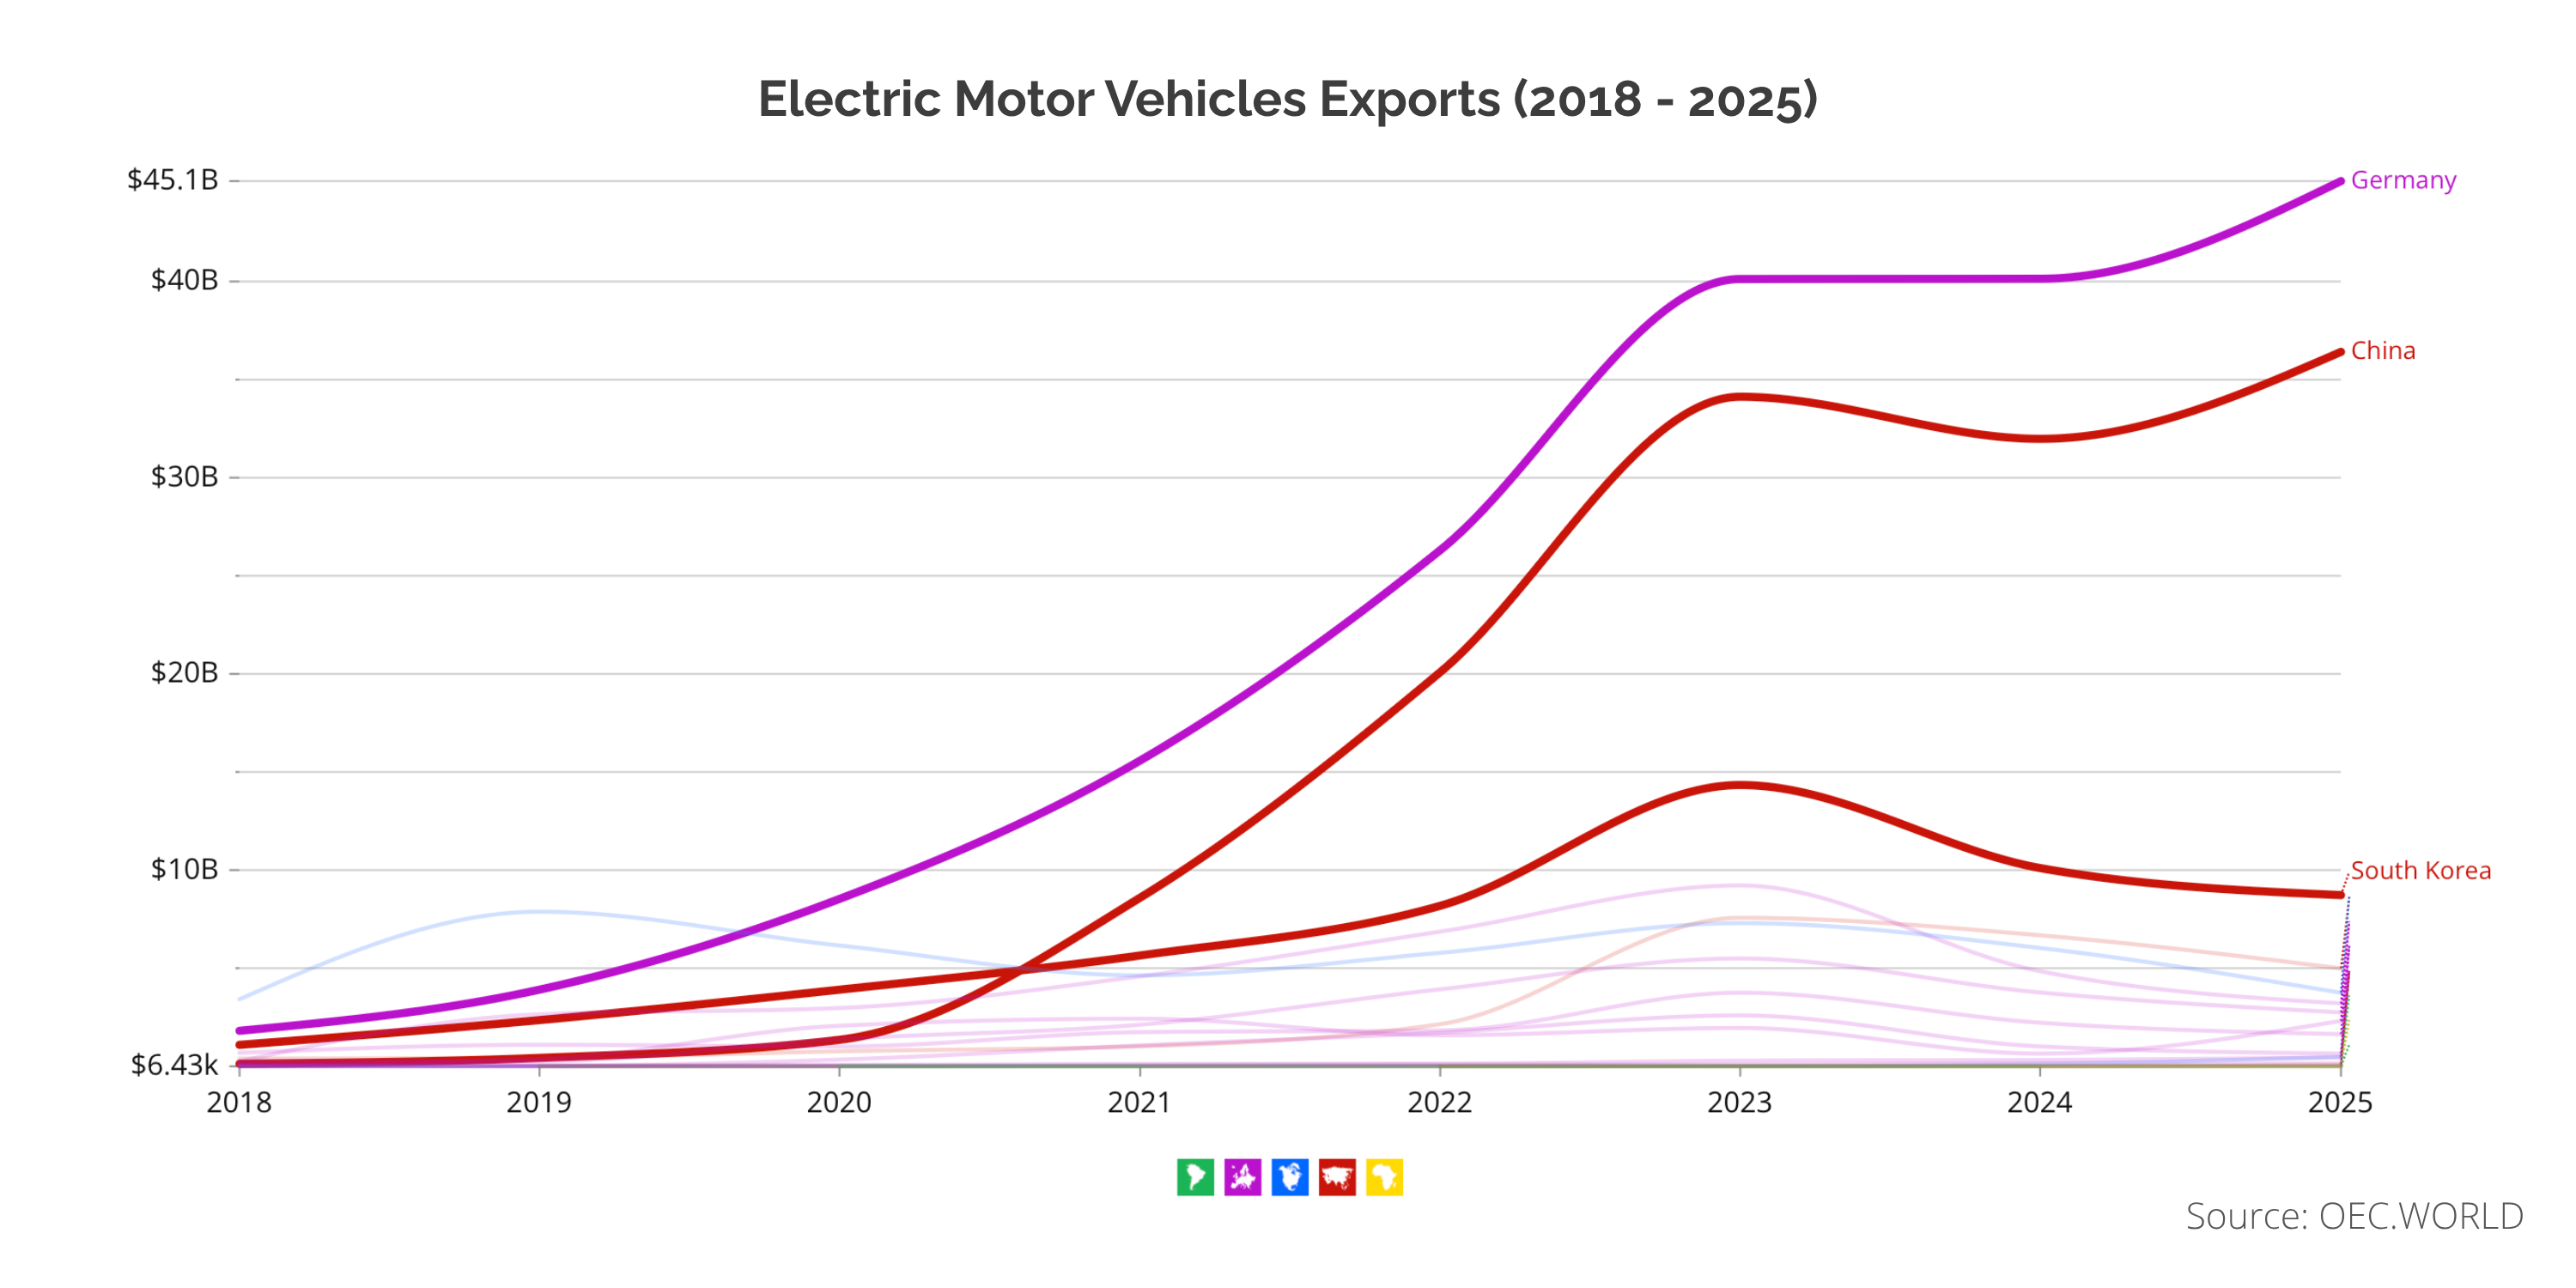
This data visualization displays "The $140B global EV market is growing 43% per year as the Strait of Hormuz closes, and gas hits record prices." and provides a clear visual representation of the underlying data patterns and trends. The visualization focuses on The global economy is relying on a structural defense built over the past 10 years as the closure of the Strait of Hormuz pushes U.S. gas prices toward $4.00. The global market for Electric Motor Vehicles (HS 870380) has reached $140 billion with an astounding 43.3% annual growth, according to data from the Observatory of Economic Complexity.
This change is a crucial security requirement, according to Ember, a global energy think tank. In their most recent report, 80% of the oil that passes through the Strait of Hormuz is destined for Asia, which accounts for 40% of the region's total oil demand, making the current crisis a deliberate blow to global stability. However, the global EV fleet already offsets \*\*70% of Iran's total oil consumption by displacing 1.7 million barrels of oil per day. The global market for Electric Motor Vehicles (HS 870380) has reached $140 billion, with an astounding 43.3% annual growth rate, according to data from the OEC.
This change is a crucial security requirement, according to Ember, a global energy think tank.
**Latest data**
Germany is the largest exporter of Electric Vehicles in the world ($45.1 billion in 2025), and while it also imports them ($11.6 billion), it still has a surplus of $33.5 billion.
Two-thirds of the world's BEV sales in 2025 will come from China, the second-largest exporter and volume leader with $36.4 billion (2025).
Up until 2024, the United States was the main importer in the world ($22.4 billion), but this value declined in 2025 ($14.3 billion) due mainly to a change in government policies. The 2026 crisis has led to a 20% surge in EV interest as consumers look to leave unstable fossil fuel markets, despite a slight decline in sales in 2025.
**Owning vs. Renting Energy**
This pivot has a clear economic incentive. Fossil fuel imports function as a recurring "rent" paid to foreign powers, according to Ember. On the other hand, an EV is a one-time asset purchase that enables a country to produce its own "fuel" locally.
The stakes are high: according to Ember, global import costs increase by $160 billion annually for every $10 increase in the price of a barrel of oil. Countries are purchasing insurance against future price spikes by trading for EVs today.
Electric cars ranked 18th among the most traded products worldwide in 2024, according to data from the OEC. The trade charts indicate that "energy security" is now found in the $140 billion global trade in motors and batteries that render oil lanes obsolete, rather than in patrolling them, as the Strait of Hormuz remains blocked.
Source: [https://oec.world/en/profile/hs/electric-motor-vehicles?multihierarchySelector1626-value=eudeu%2Caschn%2Caskor&multihierarchySelector1626-type=Origin+Country](https://oec.world/en/profile/hs/electric-motor-vehicles?multihierarchySelector1626-value=eudeu%2Caschn%2Caskor&multihierarchySelector1626-type=Origin+Country), which allows us to understand complex relationships and insights within the data through visual storytelling.
Deep Dive into the Topic
This data visualization represents a sophisticated analysis of complex information patterns that provide valuable insights into underlying trends and relationships. Data visualization serves as a bridge between raw numerical data and human understanding, transforming abstract statistics into comprehensible visual narratives.
The power of data visualization lies in its ability to reveal patterns, outliers, and correlations that might not be apparent in traditional tabular formats. Through careful selection of chart types, color schemes, and interactive elements, effective visualizations can communicate complex information quickly and accurately to diverse audiences.
Modern data visualization combines statistical analysis with design principles to create compelling visual stories. This interdisciplinary approach requires understanding both the underlying data and the cognitive processes involved in visual perception. The result is more effective communication of quantitative insights that can inform decision-making and drive positive change.
Data Analysis and Insights
The patterns revealed in this visualization demonstrate the importance of systematic data analysis in understanding complex phenomena. By examining different data segments, time periods, and categorical breakdowns, we can identify trends that inform strategic planning and decision-making processes.
Statistical analysis of this data reveals variations across different dimensions that provide insights into underlying drivers and relationships. These patterns help identify areas of opportunity, potential risks, and key performance indicators that can guide future actions and resource allocation.
The analytical approach used in this visualization enables comparison across different categories, time periods, or geographic regions, revealing insights that support evidence-based decision-making. This type of analysis is essential for organizations seeking to optimize performance and understand complex market dynamics.
Significance and Applications
This data visualization has important implications for understanding trends and patterns that affect decision-making across multiple sectors. The insights derived from this analysis can inform policy development, business strategy, resource allocation, and operational improvements.
For analysts, researchers, and decision-makers, this type of data visualization provides essential insights for strategic planning and performance optimization. Whether addressing operational challenges, market analysis, or policy development, understanding data patterns helps create more effective strategies and solutions.
The broader significance lies in how this information contributes to our understanding of complex systems and relationships. This knowledge helps predict future trends, identify potential challenges, and develop more informed approaches to problem-solving and opportunity identification.
Comments
Loading comments...
Leave a Comment
About the Author

Alex Cartwright
Senior Data Visualization Expert
Alex Cartwright is a renowned data visualization specialist and infographic designer with over 15 years of experience in...