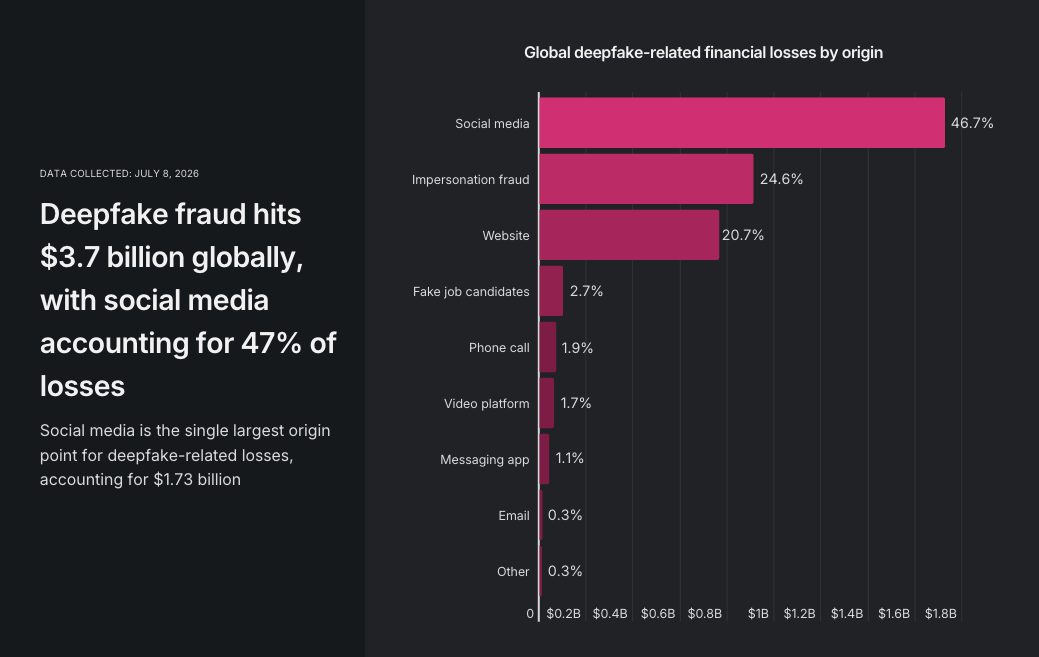
Nearly half of all deepfake fraud losses worldwide, $1.73 billion, originated from social media platforms. Visualization
Data Analysis
What This Visualization Shows
This data visualization displays "Nearly half of all deepfake fraud losses worldwide, $1.73 billion, originated from social media platforms." and provides a clear visual representation of the underlying data patterns and trends. The visualization focuses on **Methodology and sources**
This study used data from the AI Incident Database, [Resemble.AI](http://Resemble.AI), and the OECD to create a combined dataset covering deepfake incidents from January 2020 to June 2026. Incidents were included if they involved the generation of synthetic videos, images, or audio; were verified by media reports; and had clearly documented financial losses.
Each deepfake incident was classified by target country and origin. These figures represent a conservative estimate based on publicly reported data, and the source databases included records of deepfake incidents across multiple languages.
If multiple countries were mentioned in an incident with a specific financial loss, that loss was divided equally among the countries involved.
To avoid double counting, each incident was assigned to one primary origin category based on the main channel, tactic, or entry point described in the source material. The categories were defined as follows:
* Social media: cases originating on social media platforms; * Impersonation fraud: cases involving impersonation, synthetic facial verification videos, AI-generated face swaps, voice cloning, forged or altered IDs, fraudulent account openings, loan application fraud, or unauthorized access to wallets, bank accounts, or financial services; * Website: cases originating from fraudulent websites, including fake investment platforms, scam landing pages, or other web-based fraud schemes; * Fake job candidates: cases involving AI-generated resumes, face-swapping, deepfake video interviews, or other synthetic identity tactics used to infiltrate hiring processes; * Phone call: cases where deepfake-enabled voice cloning or impersonation was used during phone-based scams; * Video platform: cases originating on or using video platforms, including video conferencing tools or video-sharing platforms; * Messaging app: cases involving deepfake-enabled scams carried out through messaging applications; * Email: cases involving deepfake-enabled fraud delivered or initiated through email; * Other: cases that do not fit into the above categories, including novel schemes or unclassified methods., which allows us to understand complex relationships and insights within the data through visual storytelling.
Deep Dive into the Topic
Social and demographic data visualization provides insights into human behavior, population trends, and societal patterns that shape our communities. This type of analysis is essential for understanding social dynamics, planning public services, and addressing societal challenges through data-driven approaches.
Demographic visualizations often reveal important trends such as age distribution, migration patterns, education levels, and social mobility. These insights help urban planners design better cities, educators understand student populations, and healthcare providers allocate resources effectively. Social media analytics and survey data visualization can uncover public opinion trends, consumer preferences, and social movement patterns.
The power of social data visualization lies in its ability to make abstract social concepts tangible and actionable. By presenting complex social phenomena through charts, graphs, and interactive dashboards, researchers and policymakers can communicate findings more effectively and develop targeted interventions. This approach is particularly valuable in areas like public health, education policy, and social services planning.
Data Analysis and Insights
The patterns revealed in this visualization demonstrate the importance of systematic data analysis in understanding complex phenomena. By examining different data segments, time periods, and categorical breakdowns, we can identify trends that inform strategic planning and decision-making processes.
Statistical analysis of this data reveals variations across different dimensions that provide insights into underlying drivers and relationships. These patterns help identify areas of opportunity, potential risks, and key performance indicators that can guide future actions and resource allocation.
The analytical approach used in this visualization enables comparison across different categories, time periods, or geographic regions, revealing insights that support evidence-based decision-making. This type of analysis is essential for organizations seeking to optimize performance and understand complex market dynamics.
Significance and Applications
This data visualization has important implications for understanding trends and patterns that affect decision-making across multiple sectors. The insights derived from this analysis can inform policy development, business strategy, resource allocation, and operational improvements.
For analysts, researchers, and decision-makers, this type of data visualization provides essential insights for strategic planning and performance optimization. Whether addressing operational challenges, market analysis, or policy development, understanding data patterns helps create more effective strategies and solutions.
The broader significance lies in how this information contributes to our understanding of complex systems and relationships. This knowledge helps predict future trends, identify potential challenges, and develop more informed approaches to problem-solving and opportunity identification.
Comments
Loading comments...
Leave a Comment
About the Author

Alex Cartwright
Senior Data Visualization Expert
Alex Cartwright is a renowned data visualization specialist and infographic designer with over 15 years of experience in...