statistical-analysis Maps
259 geographic visualizations tagged with "statistical-analysis"
![I analyzed 12 years of iMessages to compare my texting habits with my girlfirend, mom, dad, and the boys [OC] Visualization I analyzed 12 years of iMessages to compare my texting habits with my girlfirend, mom, dad, and the boys [OC] Visualization](/api/images/reddit-maps/1qb234f_1768442402099.jpg)
I analyzed 12 years of iMessages to compare my texting habits with my girlfirend, mom, dad, and the boys [OC] Visualization
This data visualization displays "I analyzed 12 years of iMessages to compare my texting habits with my girlfirend, mom,...
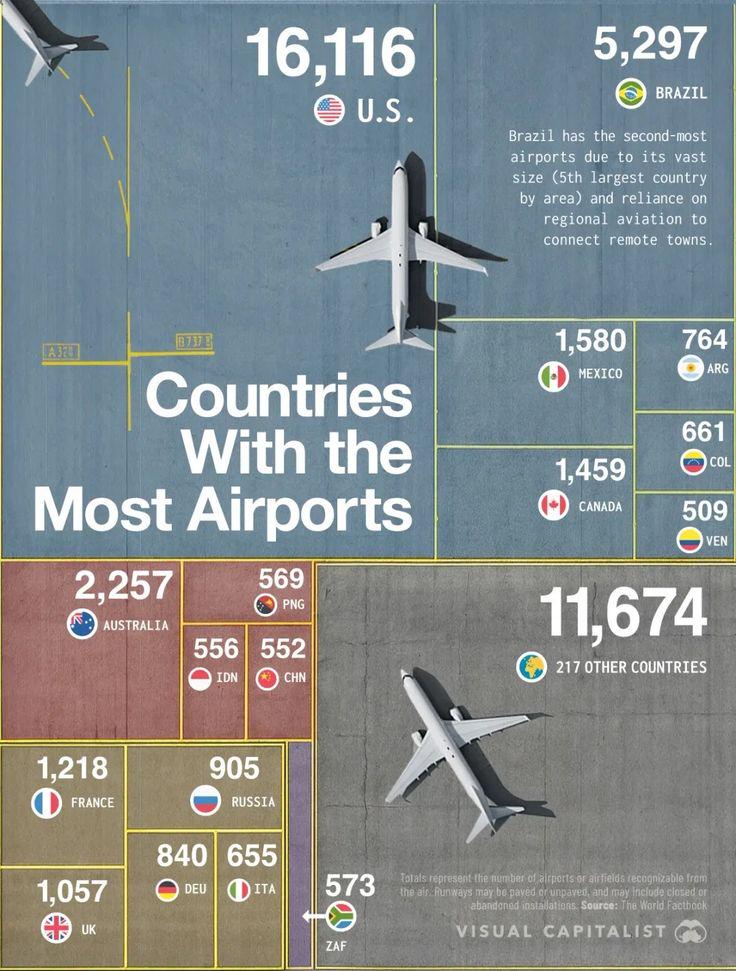
Countries With the Most Airports Visualization
This data visualization displays "Countries With the Most Airports" and provides a clear visual representation of the un...
![[OC] The Most Expensive TV Shows Of All-Time Visualization [OC] The Most Expensive TV Shows Of All-Time Visualization](/api/images/reddit-maps/1qu070a_1770055201184.jpg)
[OC] The Most Expensive TV Shows Of All-Time Visualization
This data visualization displays "[OC] The Most Expensive TV Shows Of All-Time" and provides a clear visual representati...
![[OC] Coalition Casualties in Afghanistan (2001-2021) Visualization [OC] Coalition Casualties in Afghanistan (2001-2021) Visualization](/api/images/reddit-maps/1qpn916_1769644801325.jpg)
[OC] Coalition Casualties in Afghanistan (2001-2021) Visualization
This data visualization displays "[OC] Coalition Casualties in Afghanistan (2001-2021)" and provides a clear visual repr...
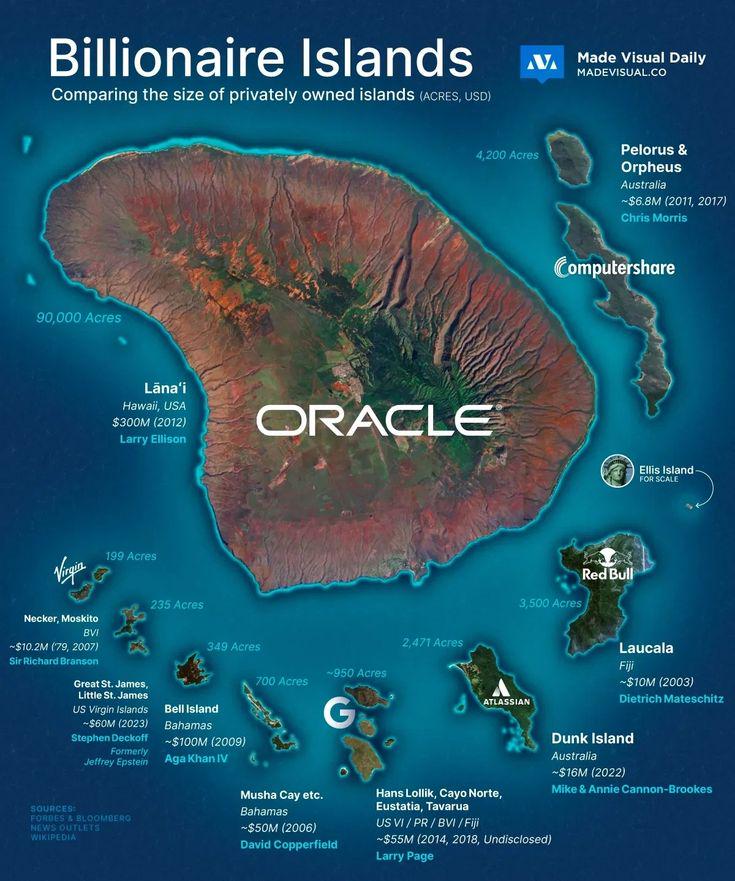
The size of billionaires' privately owned islands Visualization
This data visualization displays "The size of billionaires' privately owned islands" and provides a clear visual represe...
![[OC] For the past 3 years I've polled people on Blind at my company (FAANG) about how worried they are about AI replacing them Visualization [OC] For the past 3 years I've polled people on Blind at my company (FAANG) about how worried they are about AI replacing them Visualization](/api/images/reddit-maps/1qp1n0r_1769580001689.jpg)
[OC] For the past 3 years I've polled people on Blind at my company (FAANG) about how worried they are about AI replacing them Visualization
This data visualization displays "[OC] For the past 3 years I've polled people on Blind at my company (FAANG) about how ...
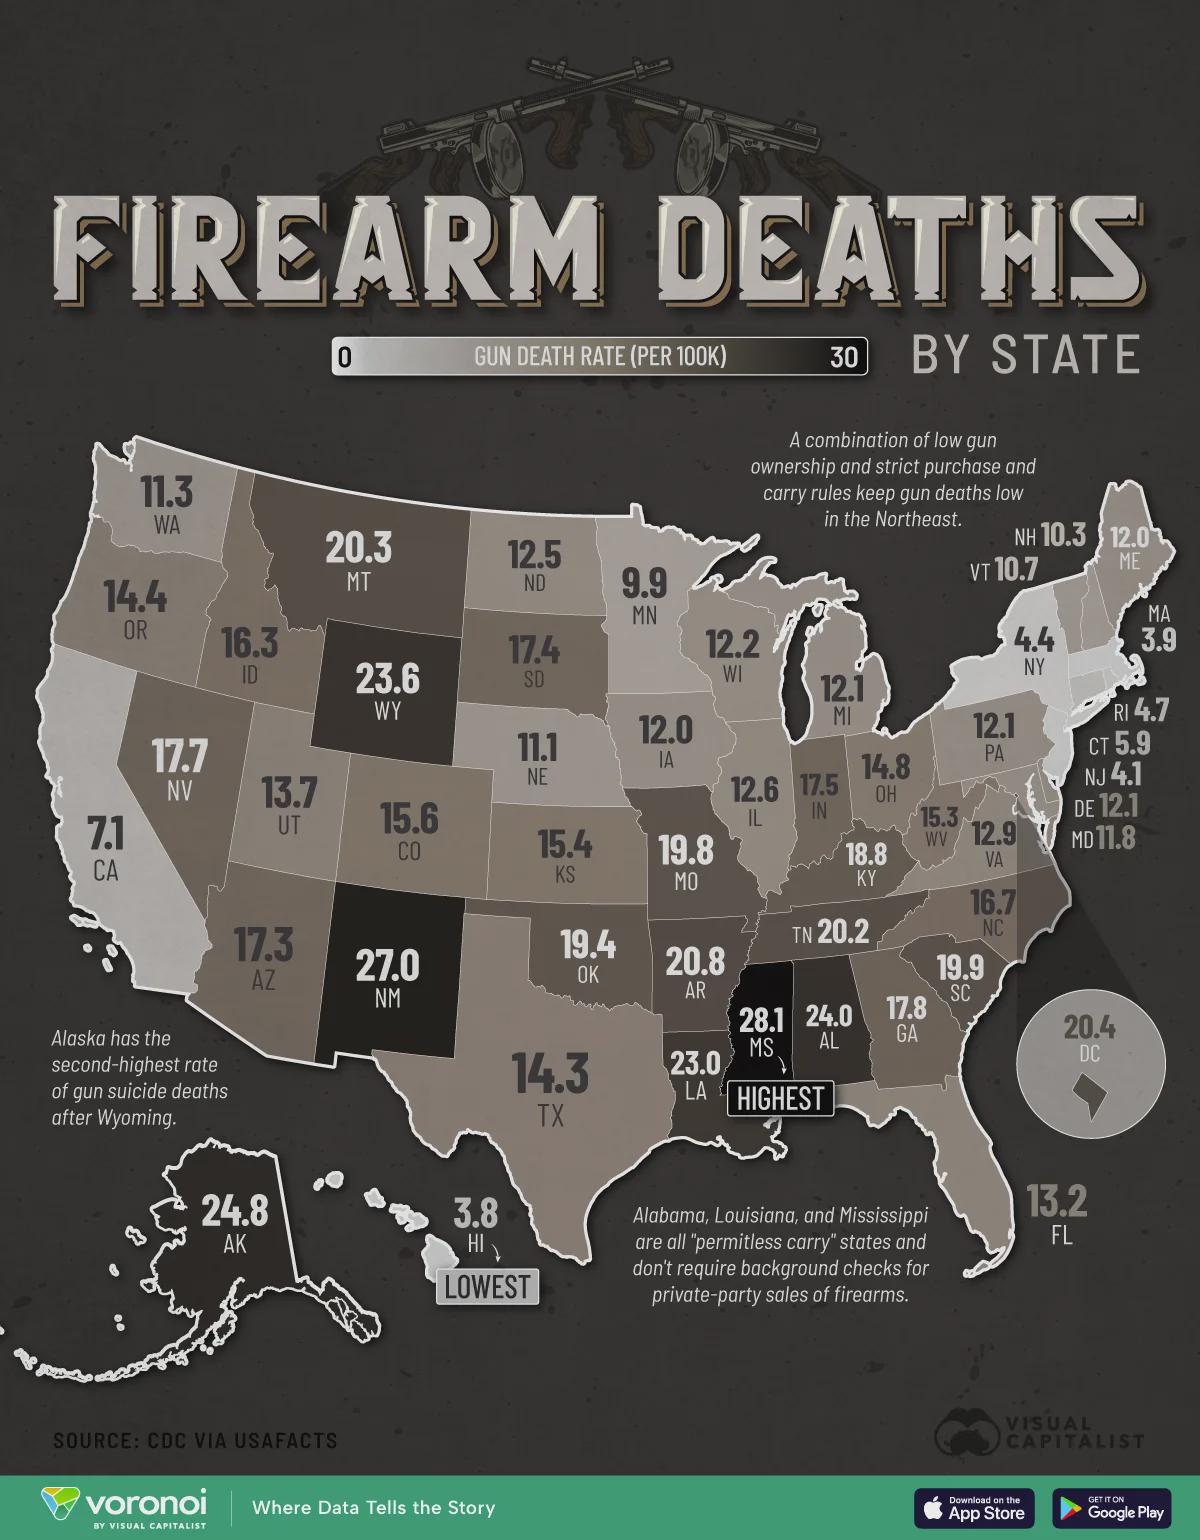
Mapped: Firearm Deaths by U.S. State Visualization
This data visualization displays "Mapped: Firearm Deaths by U.S. State" and provides a clear visual representation of th...
![[OC] Cybersecurity Vulnerabilities Discovered by Year Visualization [OC] Cybersecurity Vulnerabilities Discovered by Year Visualization](/api/images/reddit-maps/1qbvbs1_1768420801191.jpg)
[OC] Cybersecurity Vulnerabilities Discovered by Year Visualization
This data visualization displays "[OC] Cybersecurity Vulnerabilities Discovered by Year" and provides a clear visual rep...
![[OC] Day length change in minutes per week at 51 degrees north, the days are getting longer! Visualization [OC] Day length change in minutes per week at 51 degrees north, the days are getting longer! Visualization](/api/images/reddit-maps/1quvxte_1770141601129.jpg)
[OC] Day length change in minutes per week at 51 degrees north, the days are getting longer! Visualization
This data visualization displays "[OC] Day length change in minutes per week at 51 degrees north, the days are getting l...
![[OC] The Most Expensive TV Shows Of All-Time Visualization [OC] The Most Expensive TV Shows Of All-Time Visualization](/api/images/reddit-maps/1qu02vf_1770069601533.jpg)
[OC] The Most Expensive TV Shows Of All-Time Visualization
This data visualization displays "[OC] The Most Expensive TV Shows Of All-Time" and provides a clear visual representati...
![[OC] 12+ Years of messaging my wife on WhatsApp and iMessage Visualization [OC] 12+ Years of messaging my wife on WhatsApp and iMessage Visualization](/api/images/reddit-maps/1qni2lz_1769443202363.jpg)
[OC] 12+ Years of messaging my wife on WhatsApp and iMessage Visualization
This data visualization displays "[OC] 12+ Years of messaging my wife on WhatsApp and iMessage" and provides a clear vis...
![[OC] The North-South Divide: Government Debt-to-GDP Ratios in the European Union Visualization [OC] The North-South Divide: Government Debt-to-GDP Ratios in the European Union Visualization](/api/images/reddit-maps/1qkpn7e_1769184001104.jpg)
[OC] The North-South Divide: Government Debt-to-GDP Ratios in the European Union Visualization
This data visualization displays "[OC] The North-South Divide: Government Debt-to-GDP Ratios in the European Union" and ...
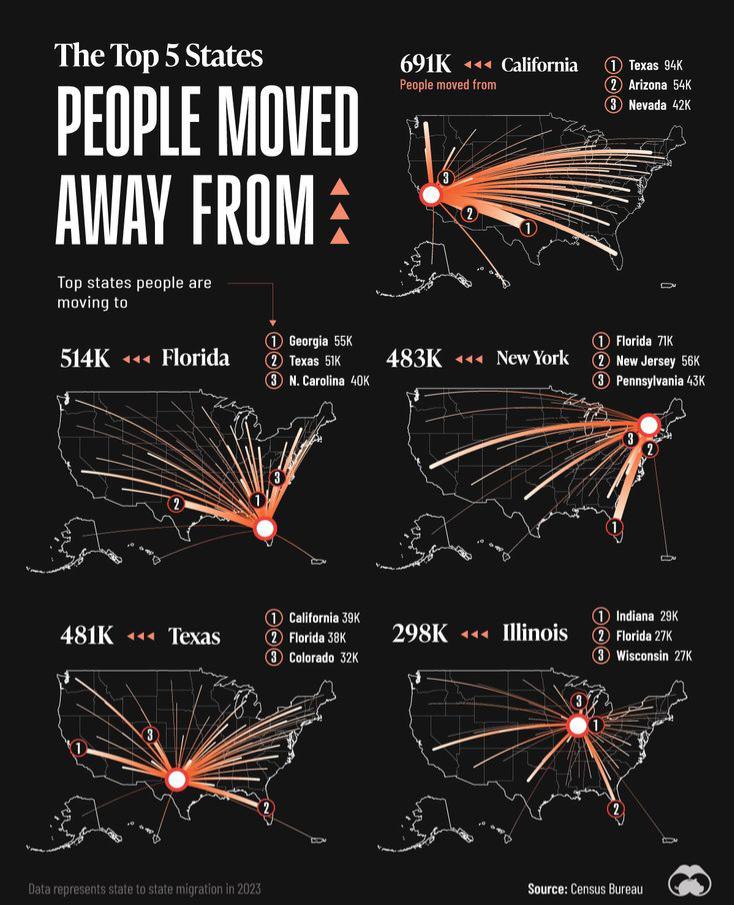
The Top 5 US States People Moved Away From Visualization
This data visualization displays "The Top 5 US States People Moved Away From" and provides a clear visual representation...
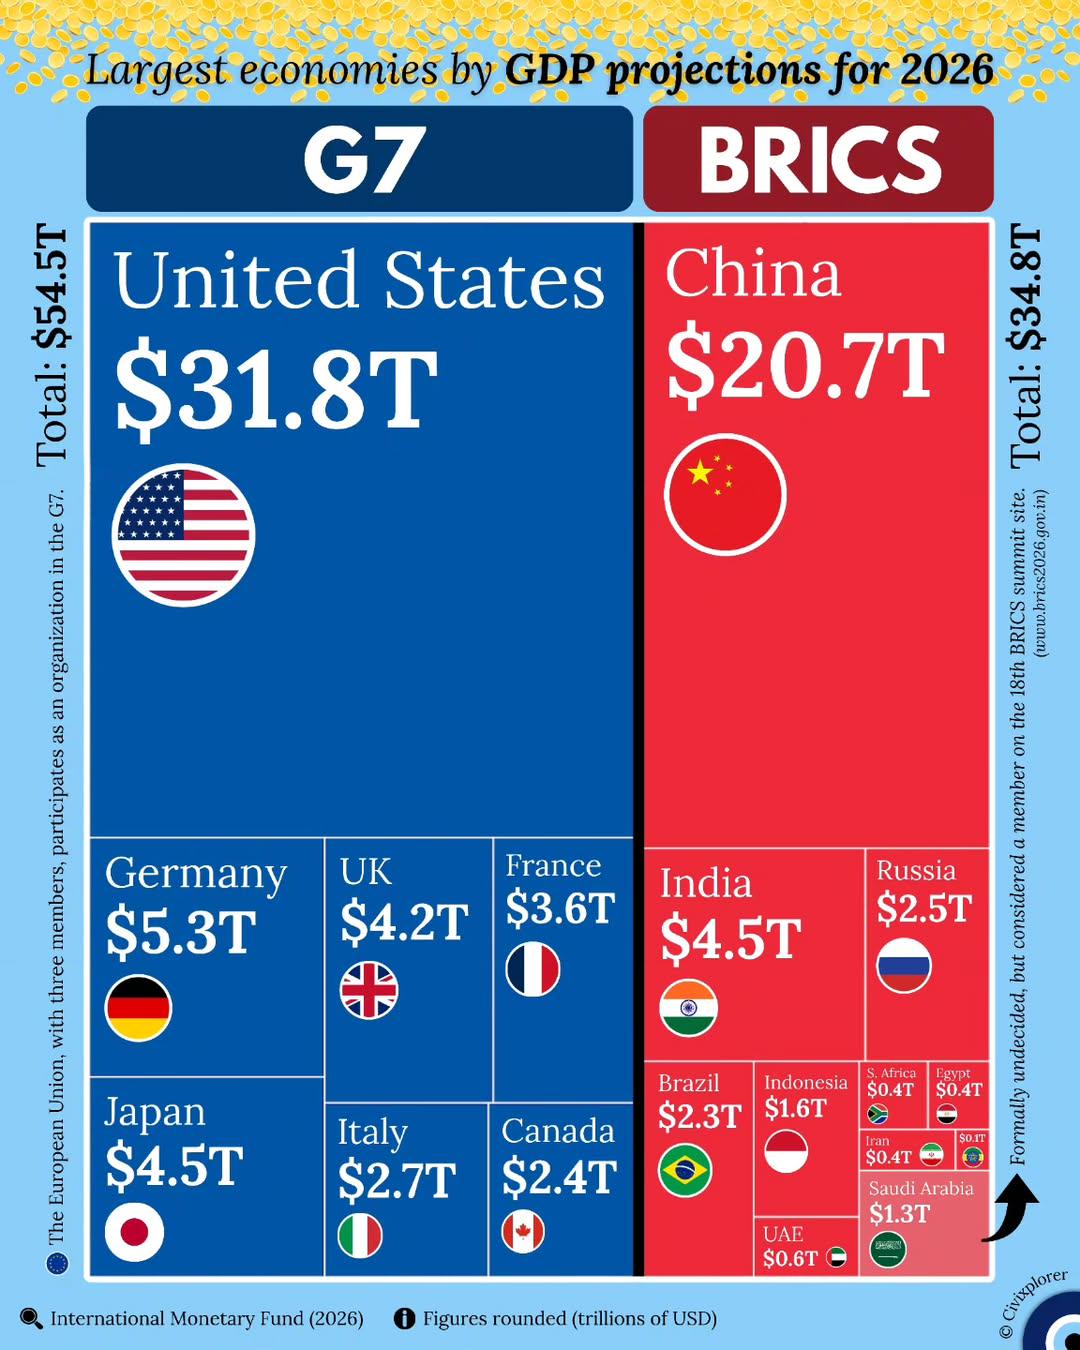
Largest economies by GDP projections for 2026 Visualization
This data visualization displays "Largest economies by GDP projections for 2026" and provides a clear visual representat...
![My Experience as a Hiring Manager in 2025 at a Union Manufacturing Facility [OC] Visualization My Experience as a Hiring Manager in 2025 at a Union Manufacturing Facility [OC] Visualization](/api/images/reddit-maps/1qni3kr_1769443203380.jpg)
My Experience as a Hiring Manager in 2025 at a Union Manufacturing Facility [OC] Visualization
This data visualization displays "My Experience as a Hiring Manager in 2025 at a Union Manufacturing Facility [OC]" and ...
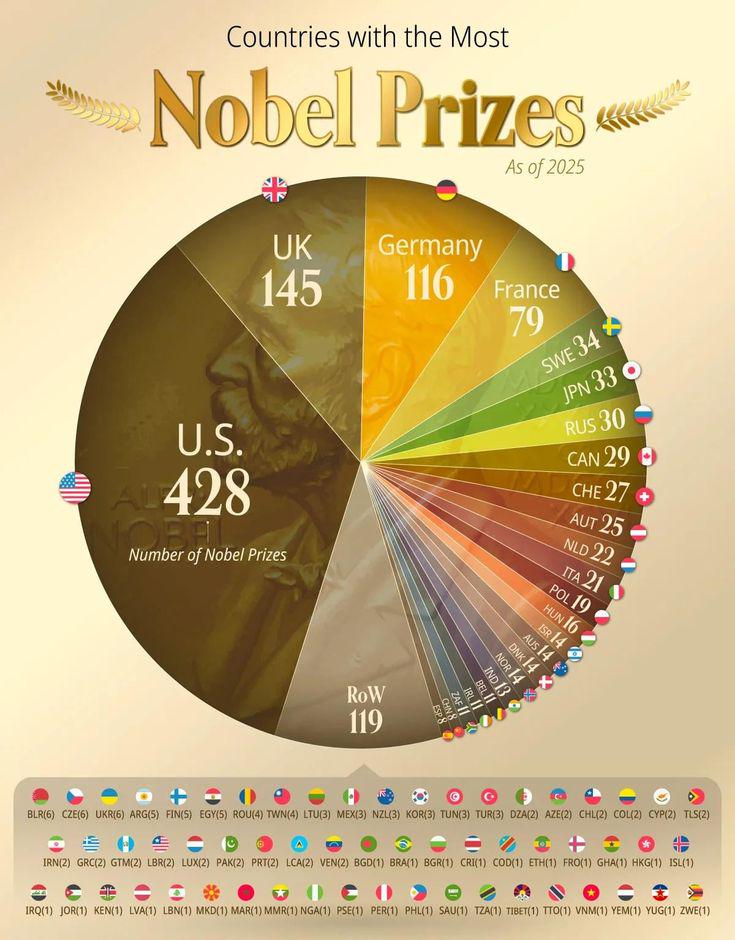
Countries with the most Nobel Prizes Visualization
This data visualization displays "Countries with the most Nobel Prizes" and provides a clear visual representation of th...
![Weekly fuel price oscillation in Helsinki area in Finland [OC] Visualization Weekly fuel price oscillation in Helsinki area in Finland [OC] Visualization](/api/images/reddit-maps/1qmrr2q_1769385601192.jpg)
Weekly fuel price oscillation in Helsinki area in Finland [OC] Visualization
This data visualization displays "Weekly fuel price oscillation in Helsinki area in Finland [OC]" and provides a clear v...
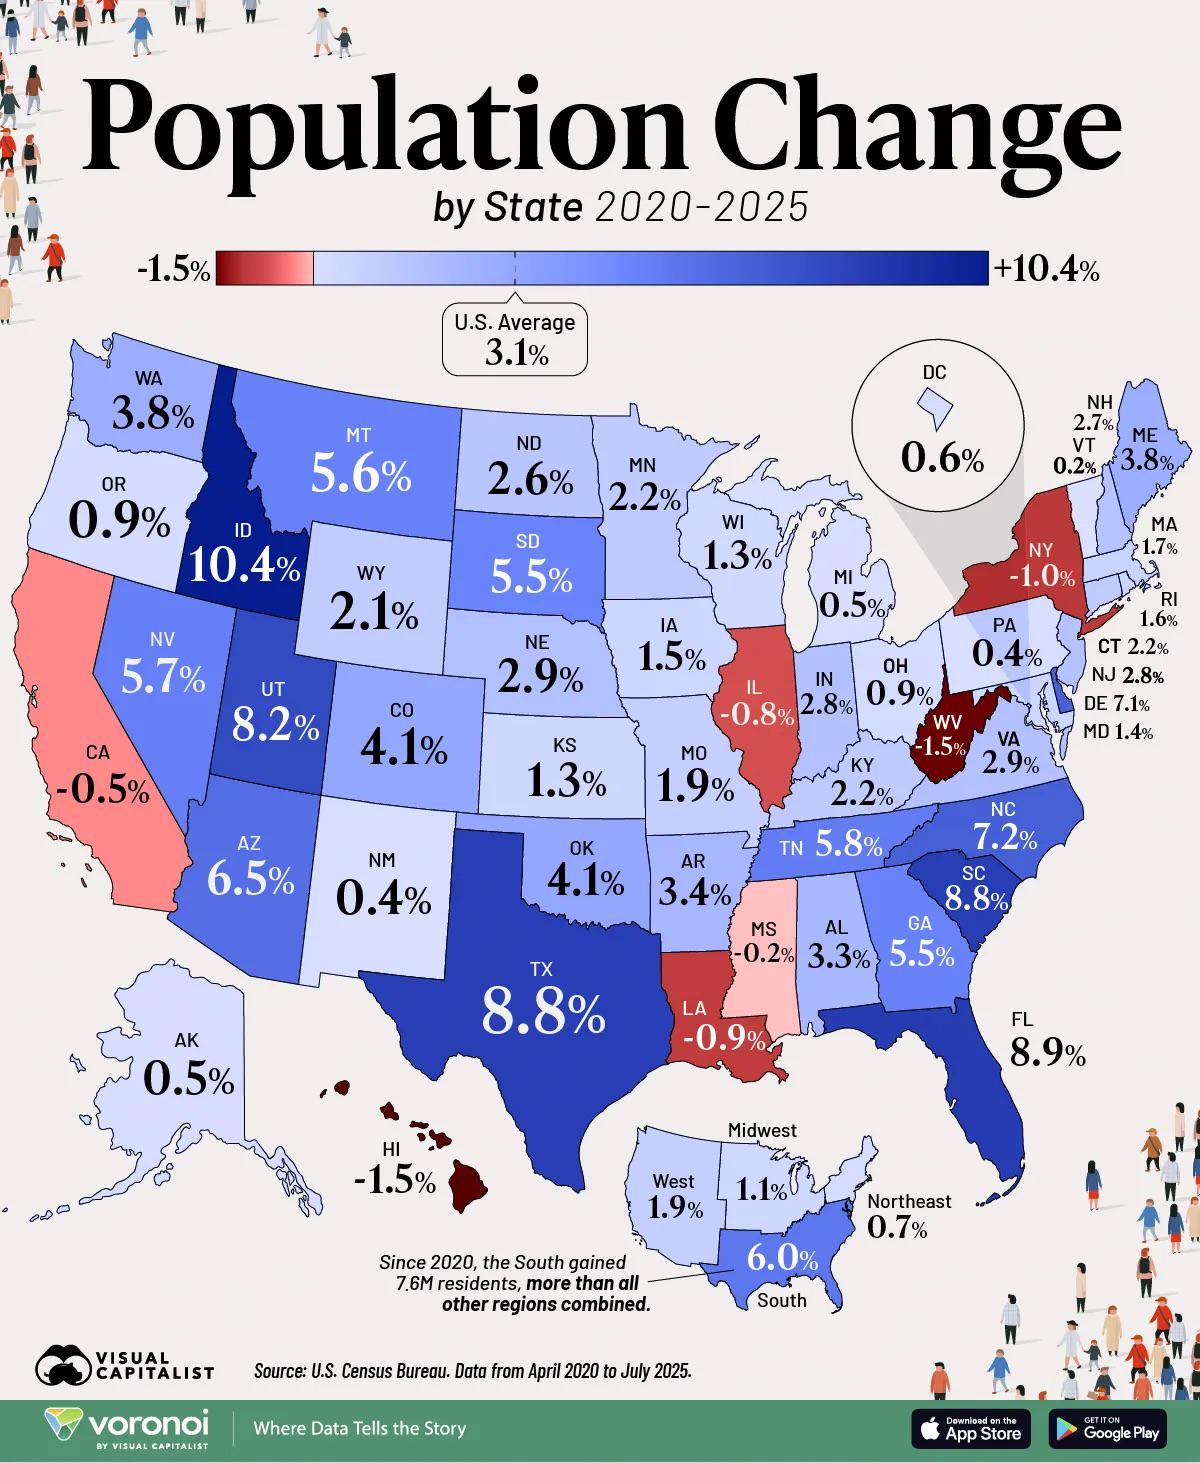
U.S. Population Growth by State (2020-2025) Data Visualization
This data visualization displays "U.S. Population Growth by State (2020-2025)" and provides a clear visual representatio...
![Temperature of my minivan vent air during a drive to the grocery store [OC] Visualization Temperature of my minivan vent air during a drive to the grocery store [OC] Visualization](/api/images/reddit-maps/1qnkikz_1769450401107.jpg)
Temperature of my minivan vent air during a drive to the grocery store [OC] Visualization
This data visualization displays "Temperature of my minivan vent air during a drive to the grocery store [OC]" and provi...
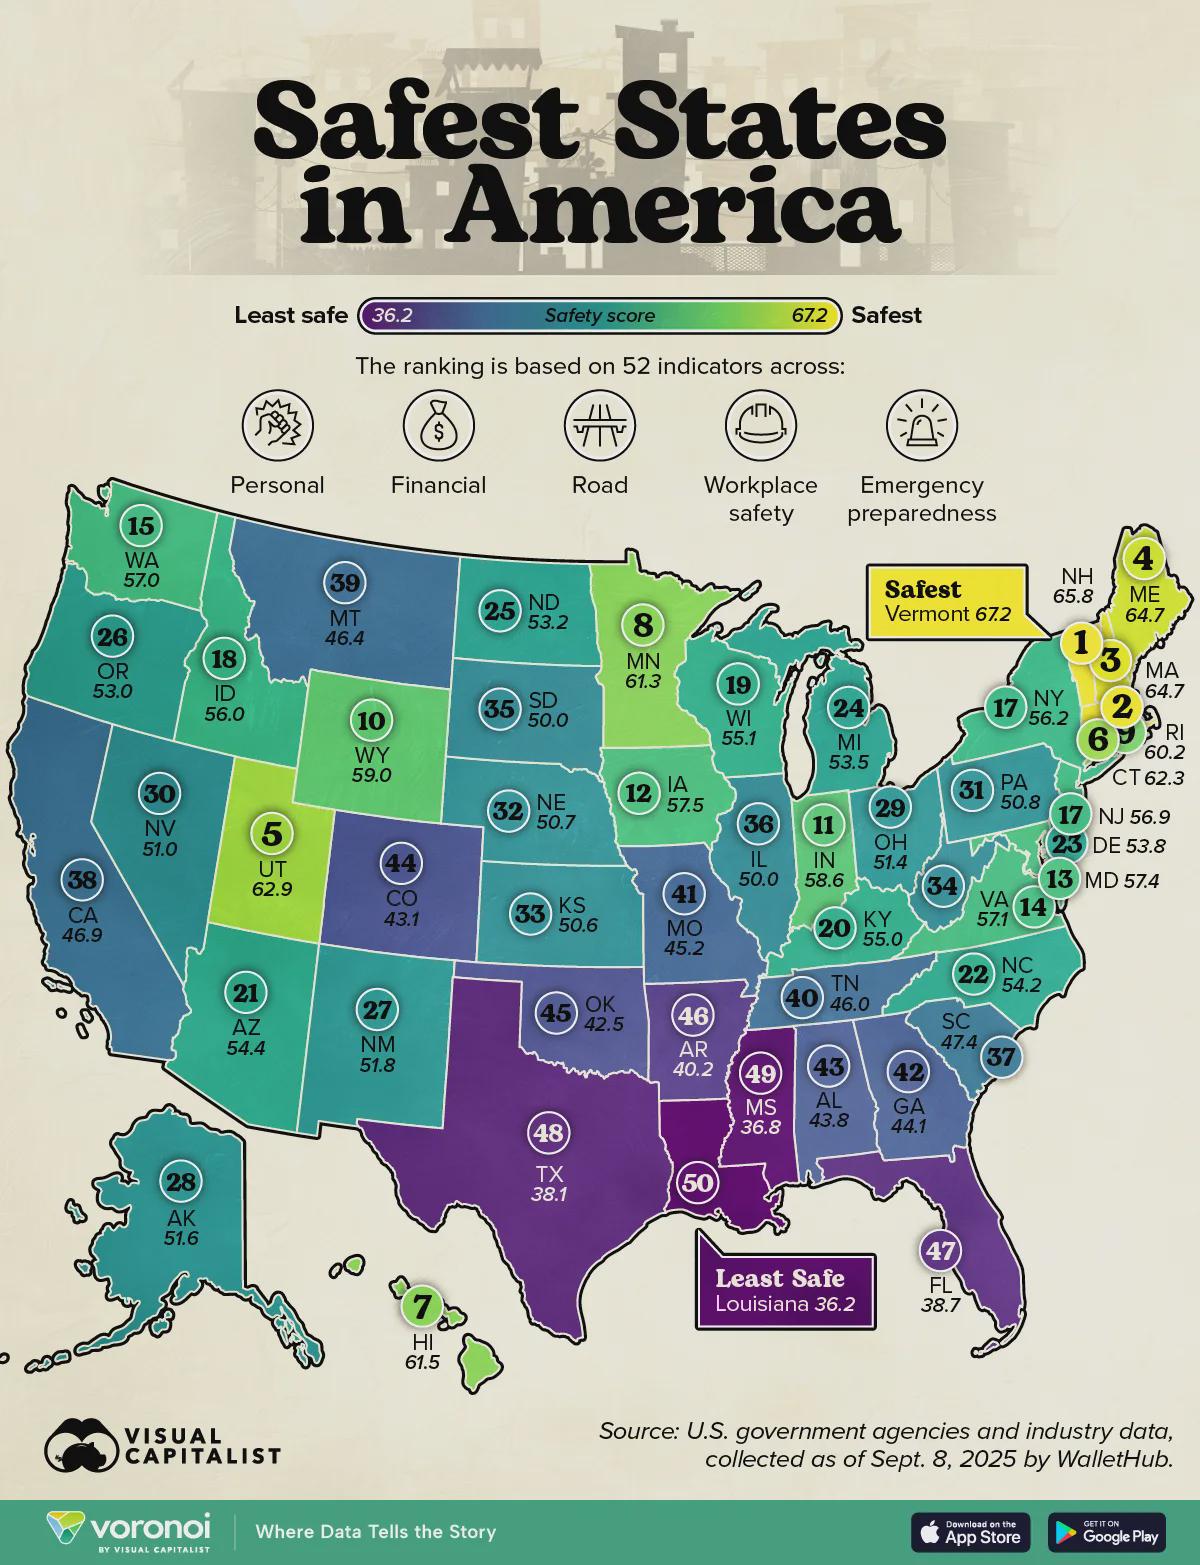
Mapped: Safest States in America Visualization
This data visualization displays "Mapped: Safest States in America" and provides a clear visual representation of the un...
![[OC] 31/F lesbian, 4 months of Hinge. Visualization [OC] 31/F lesbian, 4 months of Hinge. Visualization](/api/images/reddit-maps/1qnm7f2_1769450401859.jpg)
[OC] 31/F lesbian, 4 months of Hinge. Visualization
This data visualization displays "[OC] 31/F lesbian, 4 months of Hinge." and provides a clear visual representation of t...
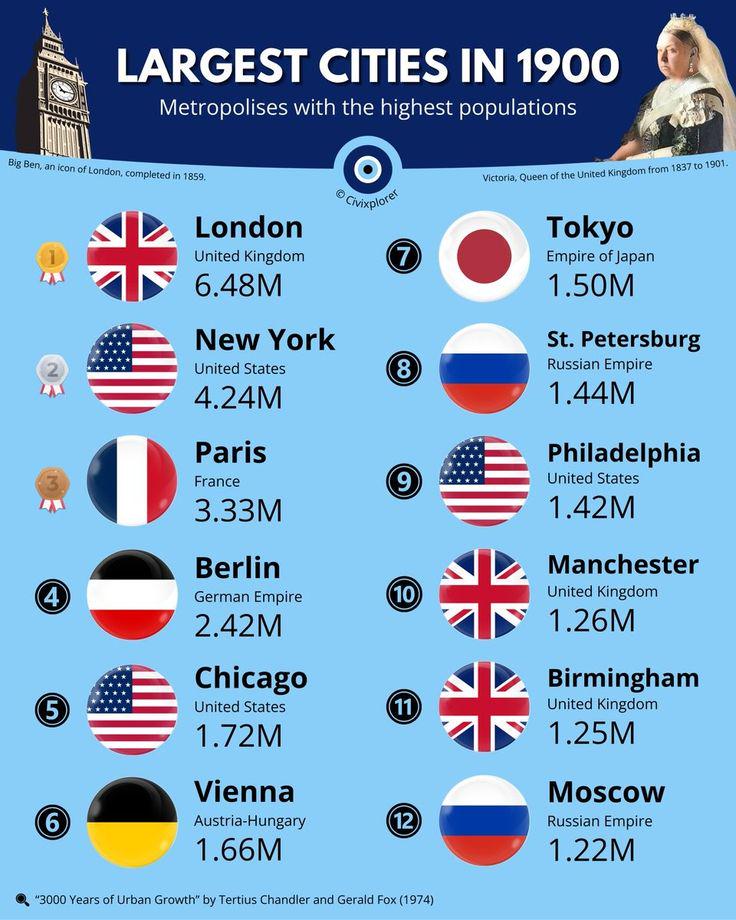
Most Populated Cities in 1900 Visualization
This data visualization displays "Most Populated Cities in 1900" and provides a clear visual representation of the under...
![[OC] How Visa made its latest Billions Visualization [OC] How Visa made its latest Billions Visualization](/api/images/reddit-maps/1qr9bge_1769810402181.jpg)
[OC] How Visa made its latest Billions Visualization
This data visualization displays "[OC] How Visa made its latest Billions" and provides a clear visual representation of ...
![Public Acceptability of Standard U.S. Animal Agriculture Practices [OC] Visualization Public Acceptability of Standard U.S. Animal Agriculture Practices [OC] Visualization](/api/images/reddit-maps/1qdicm4_1768485601846.jpg)
Public Acceptability of Standard U.S. Animal Agriculture Practices [OC] Visualization
This data visualization displays "Public Acceptability of Standard U.S. Animal Agriculture Practices [OC]" and provides ...
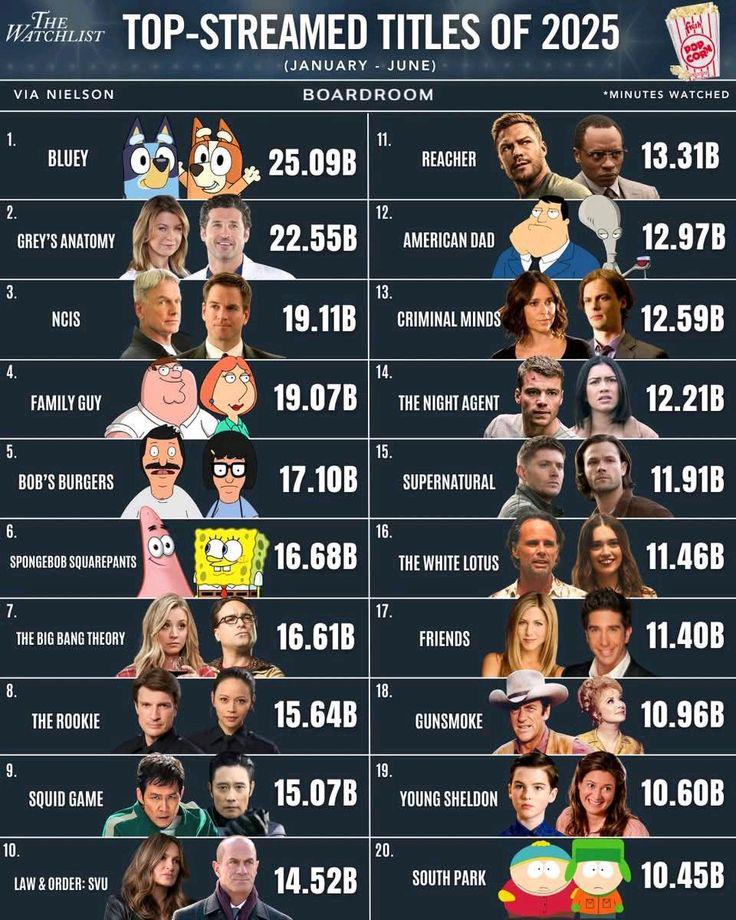
Top-Streamed Titles of 2025 Visualization
This data visualization displays "Top-Streamed Titles of 2025" and provides a clear visual representation of the underly...
![[OC] Top 10 Safest & Most Dangerous Cities in the United States (2023) Visualization [OC] Top 10 Safest & Most Dangerous Cities in the United States (2023) Visualization](/api/images/reddit-maps/1qq8h1g_1769695201839.jpg)
[OC] Top 10 Safest & Most Dangerous Cities in the United States (2023) Visualization
This data visualization displays "[OC] Top 10 Safest & Most Dangerous Cities in the United States (2023)" and provid...
![[OC] 2025 Best Selling Vehicles (US) Visualization [OC] 2025 Best Selling Vehicles (US) Visualization](/api/images/reddit-maps/1qi4rmu_1768932001116.jpg)
[OC] 2025 Best Selling Vehicles (US) Visualization
This data visualization displays "[OC] 2025 Best Selling Vehicles (US)" and provides a clear visual representation of th...
![[OC] I simulated Matchday 8 of the Champions League 20,000 times. Here is the probability distribution of the final League Phase standings. Visualization [OC] I simulated Matchday 8 of the Champions League 20,000 times. Here is the probability distribution of the final League Phase standings. Visualization](/api/images/reddit-maps/1qoqz7o_1769565602509.jpg)
[OC] I simulated Matchday 8 of the Champions League 20,000 times. Here is the probability distribution of the final League Phase standings. Visualization
This data visualization displays "[OC] I simulated Matchday 8 of the Champions League 20,000 times. Here is the probabil...
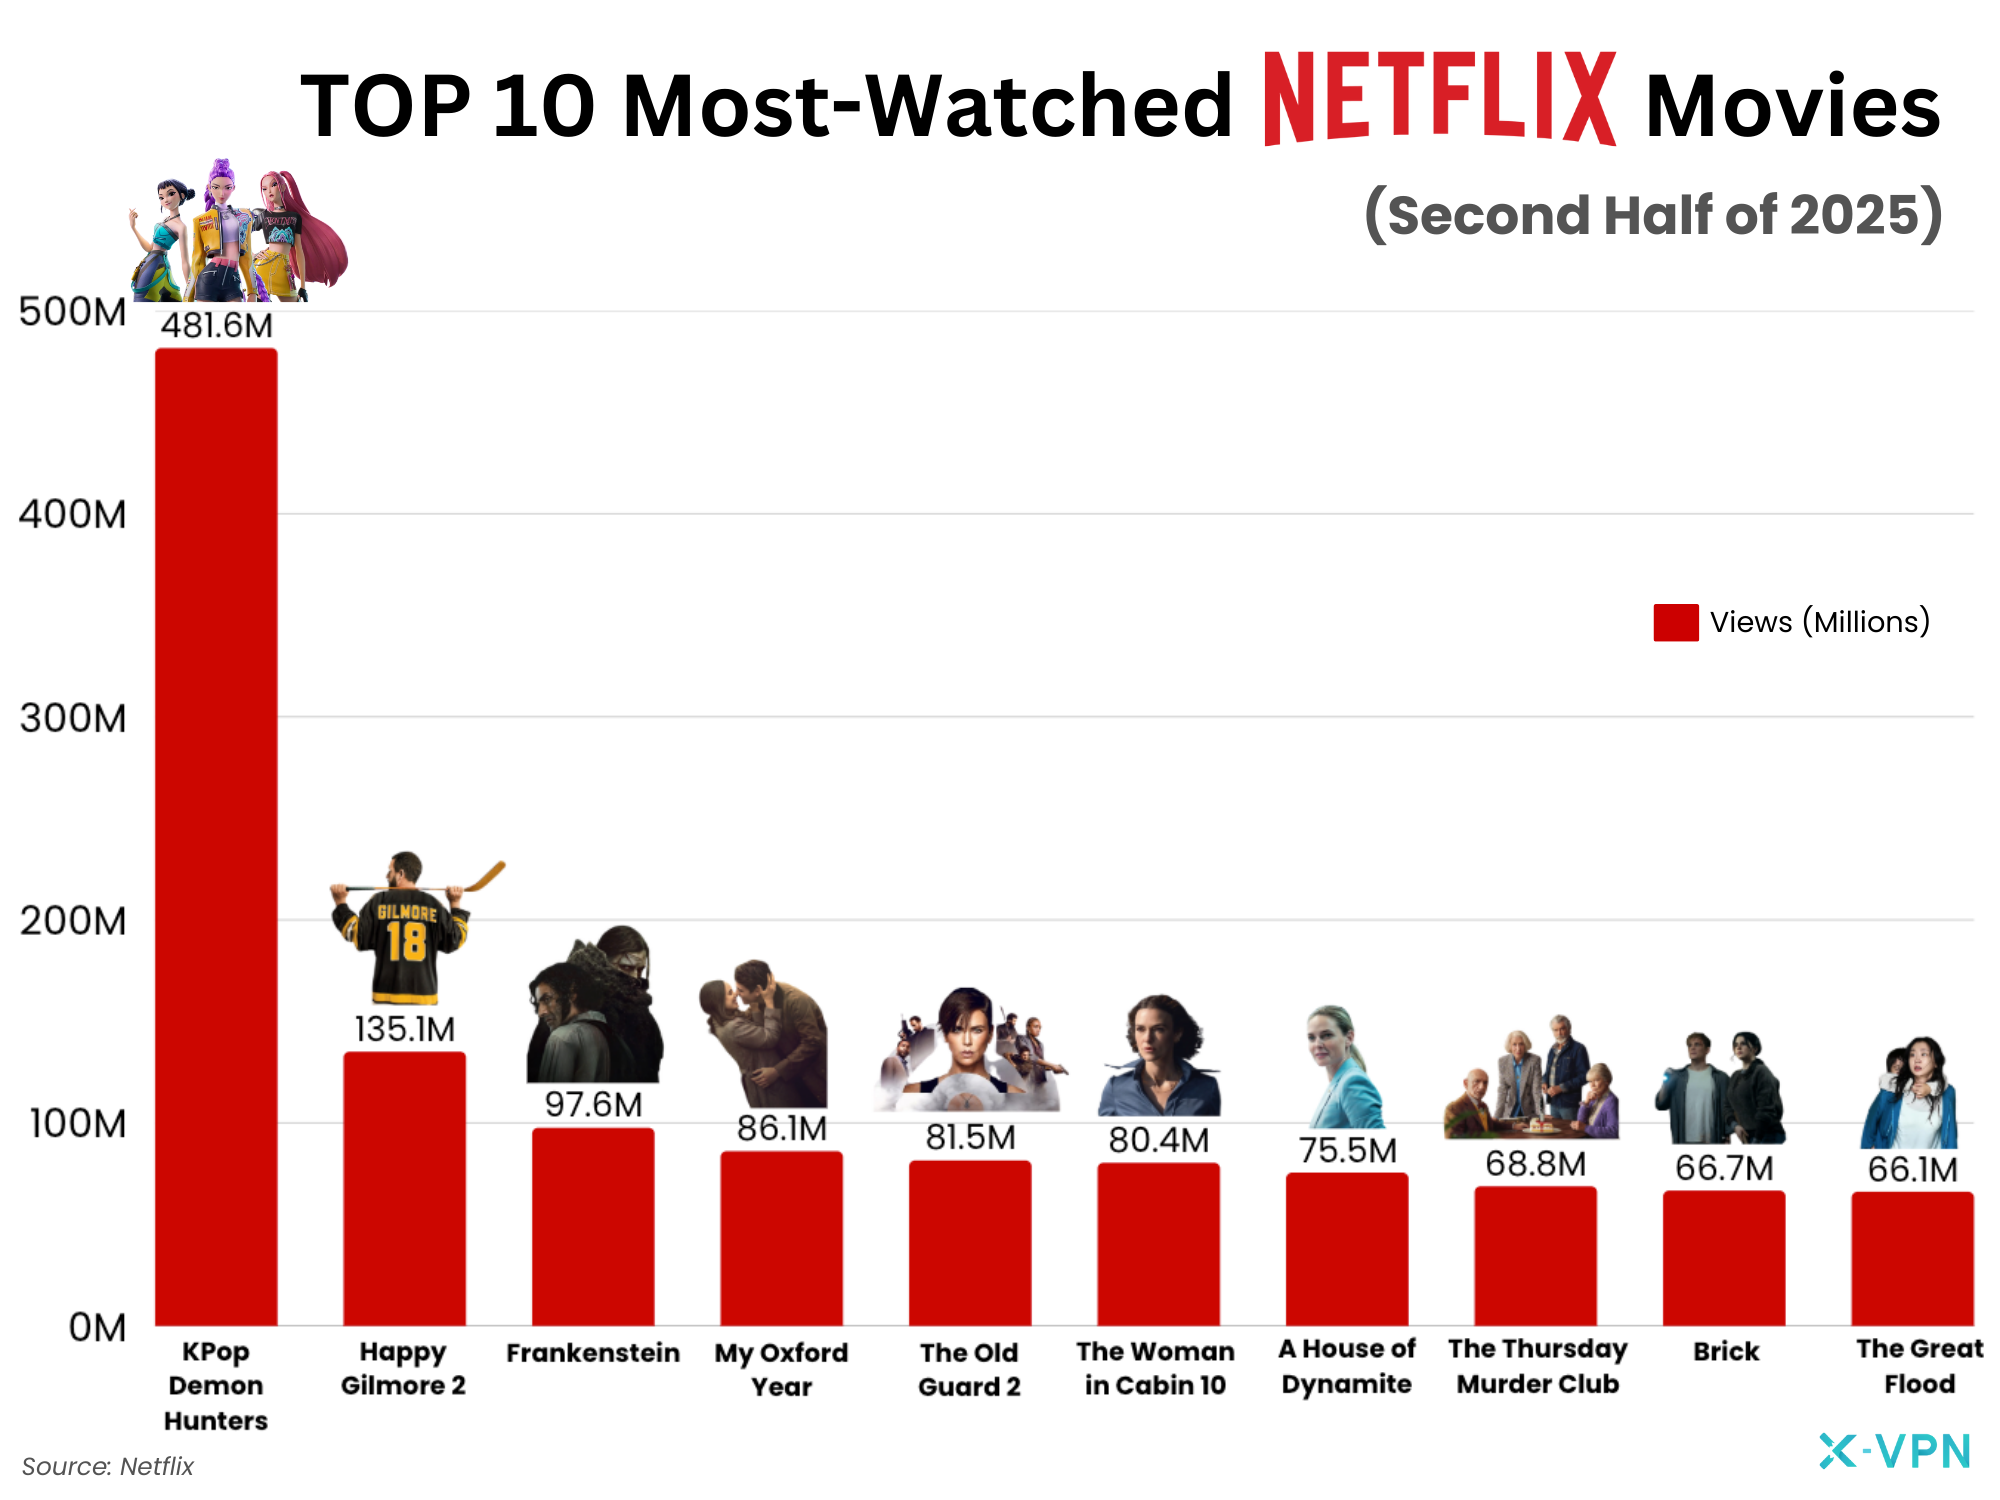
Netflix’s Top 10 Most-Watched Movies (Second Half of 2025) Visualization
This data visualization displays "Netflix’s Top 10 Most-Watched Movies (Second Half of 2025)" and provides a clear visua...
![Are groundhogs good at predicting spring? [OC] Visualization Are groundhogs good at predicting spring? [OC] Visualization](/api/images/reddit-maps/1qu0q59_1770055202780.jpg)
Are groundhogs good at predicting spring? [OC] Visualization
This data visualization displays "Are groundhogs good at predicting spring? [OC]" and provides a clear visual representa...
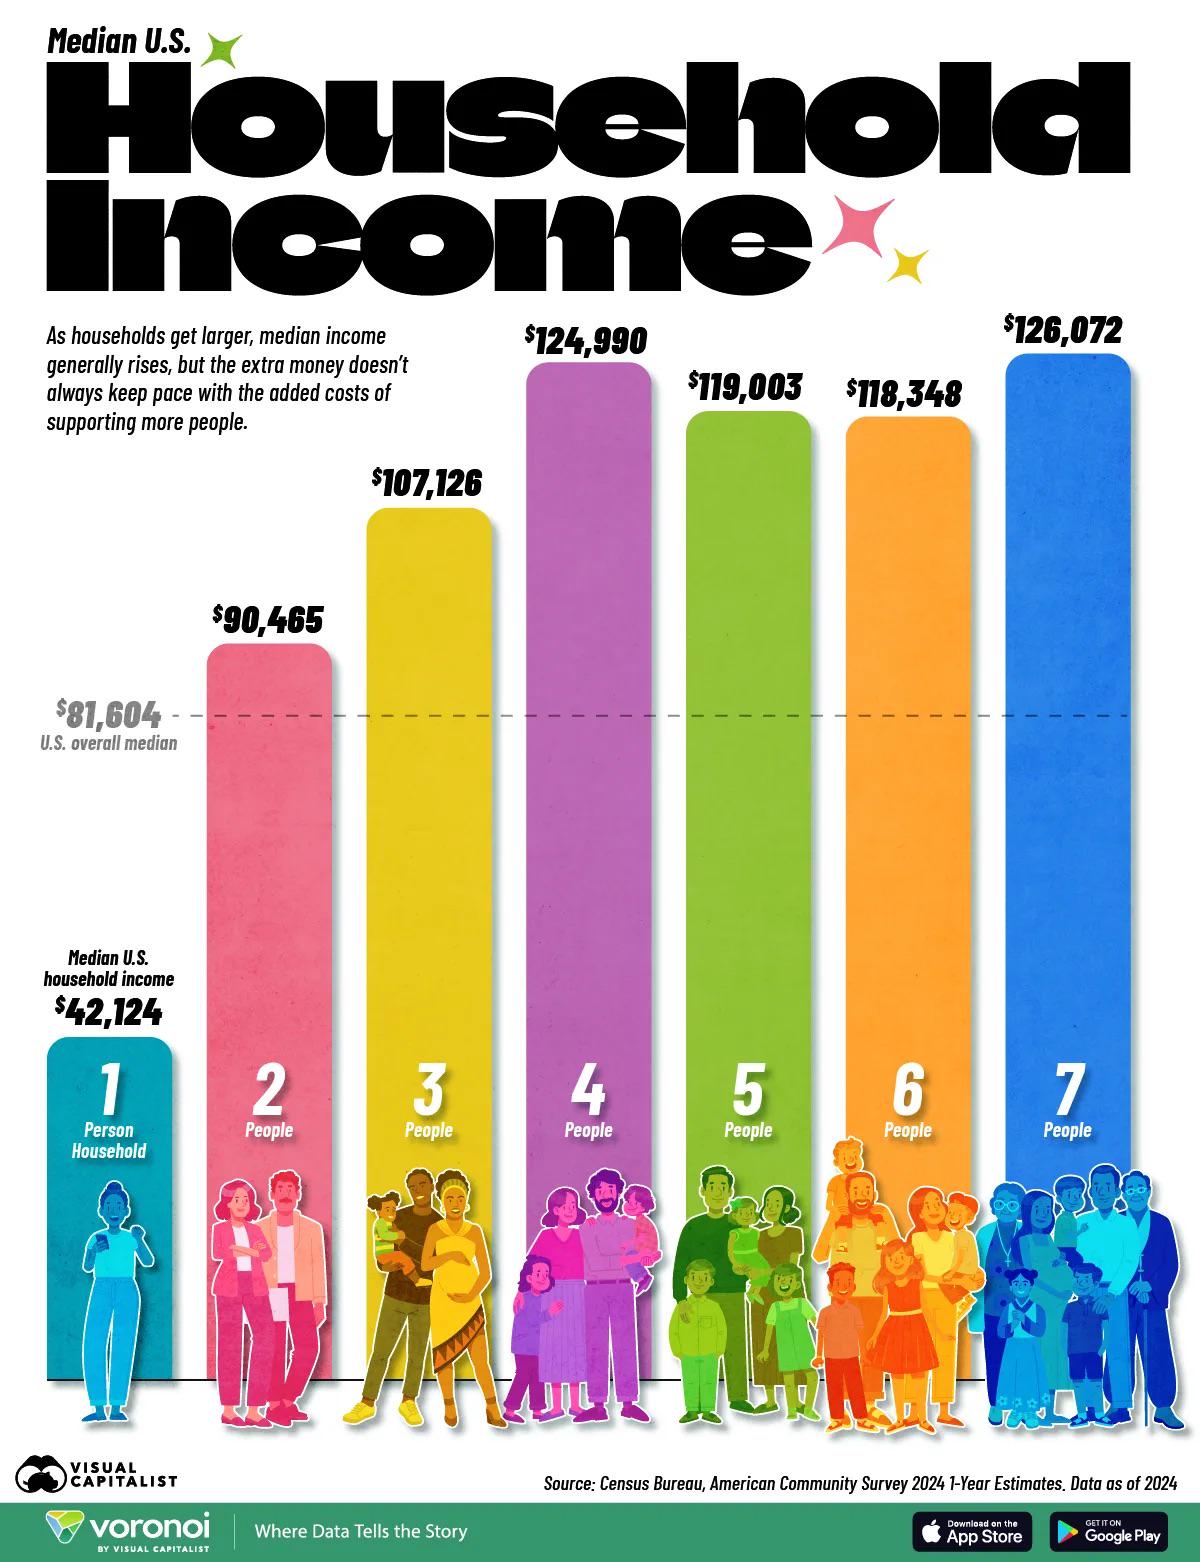
Household income, based on size Visualization
This data visualization displays "Household income, based on size" and provides a clear visual representation of the und...
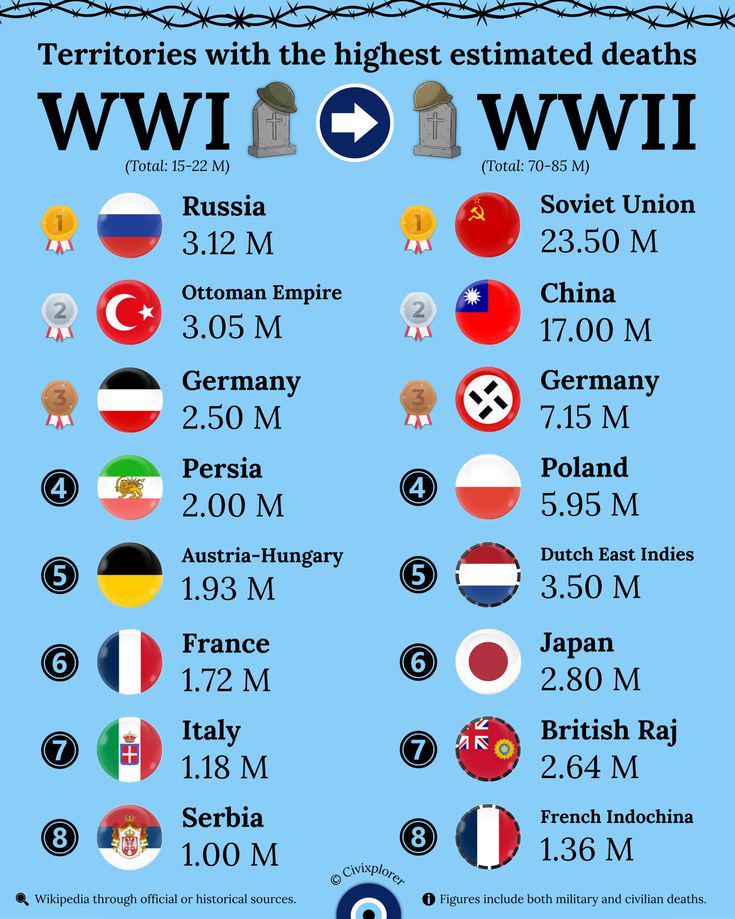
Territories with the highest estimated deaths in WW1 & WW2 Visualization
This data visualization displays "Territories with the highest estimated deaths in WW1 & WW2" and provides a clear v...
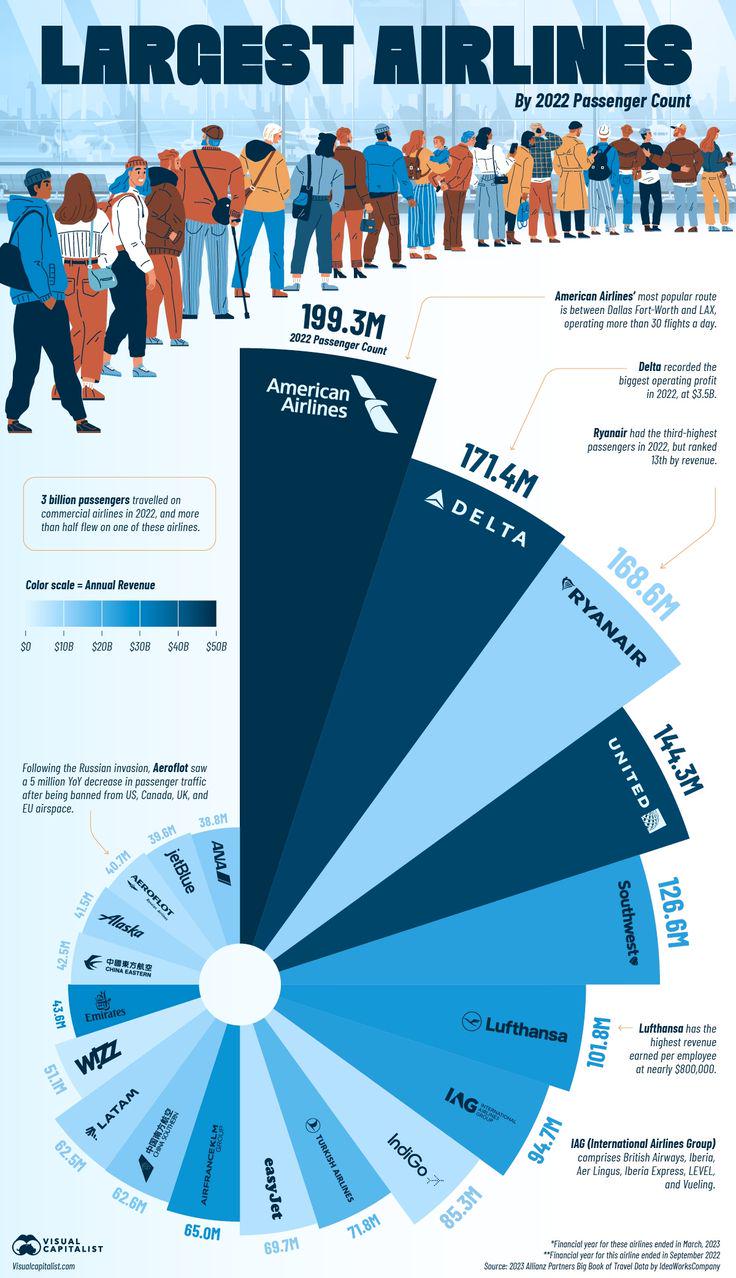
Largest Airlines by Passenger Count Visualization
This data visualization displays "Largest Airlines by Passenger Count" and provides a clear visual representation of the...
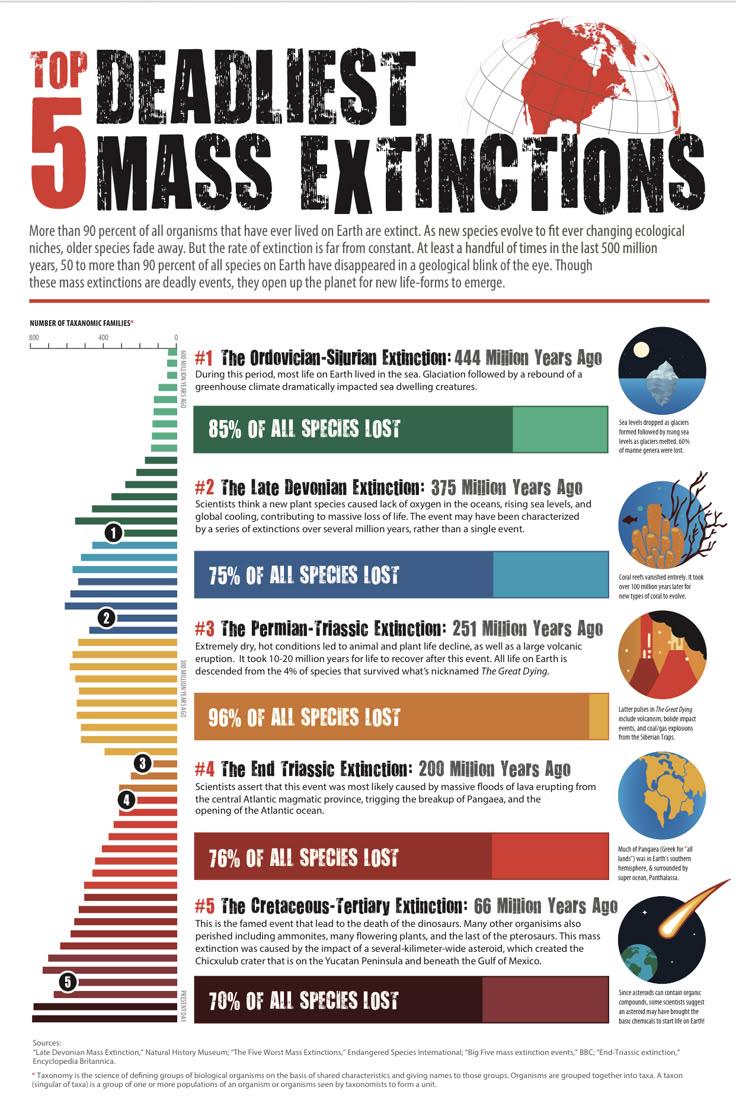
Top 5 Deadliest Mass Extinctions Visualization
This data visualization displays "Top 5 Deadliest Mass Extinctions" and provides a clear visual representation of the un...
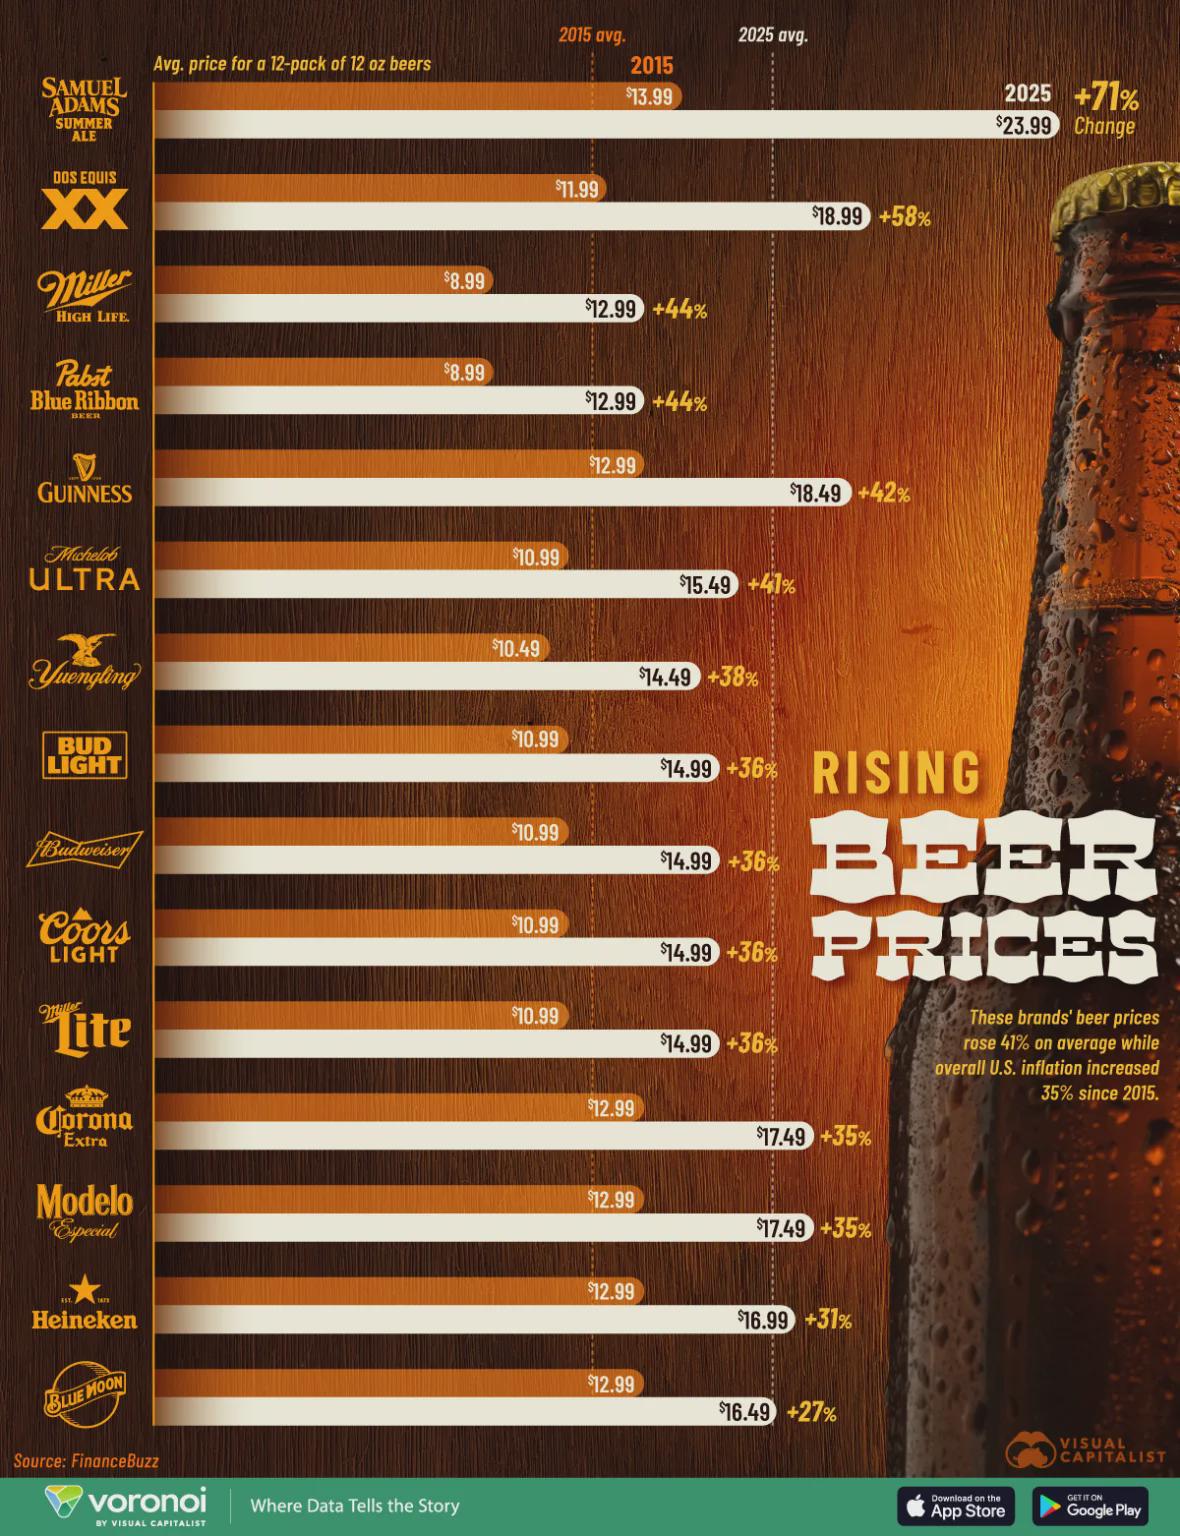
The Rising Prices of Popular Beer Brands (2015–2025) Visualization
This data visualization displays "The Rising Prices of Popular Beer Brands (2015–2025)" and provides a clear visual repr...
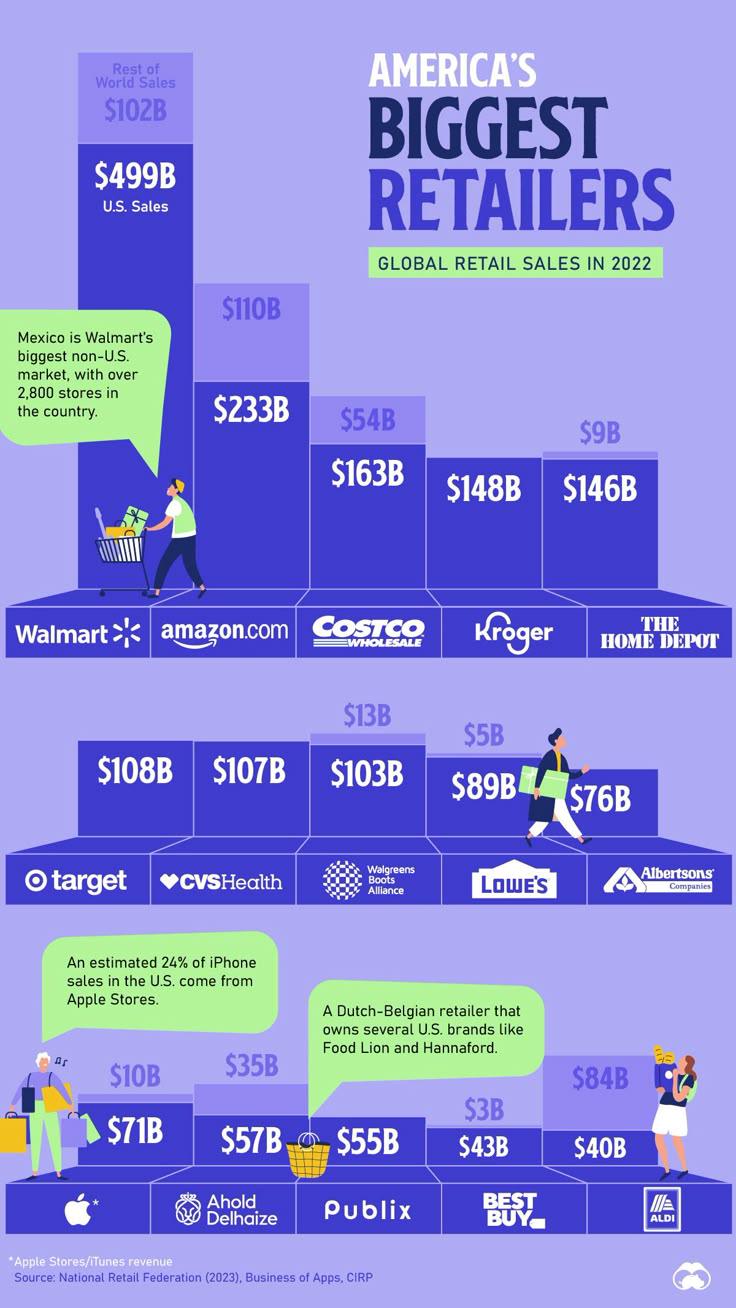
America's Biggest Retailers Visualization
This data visualization displays "America's Biggest Retailers" and provides a clear visual representation of the underly...
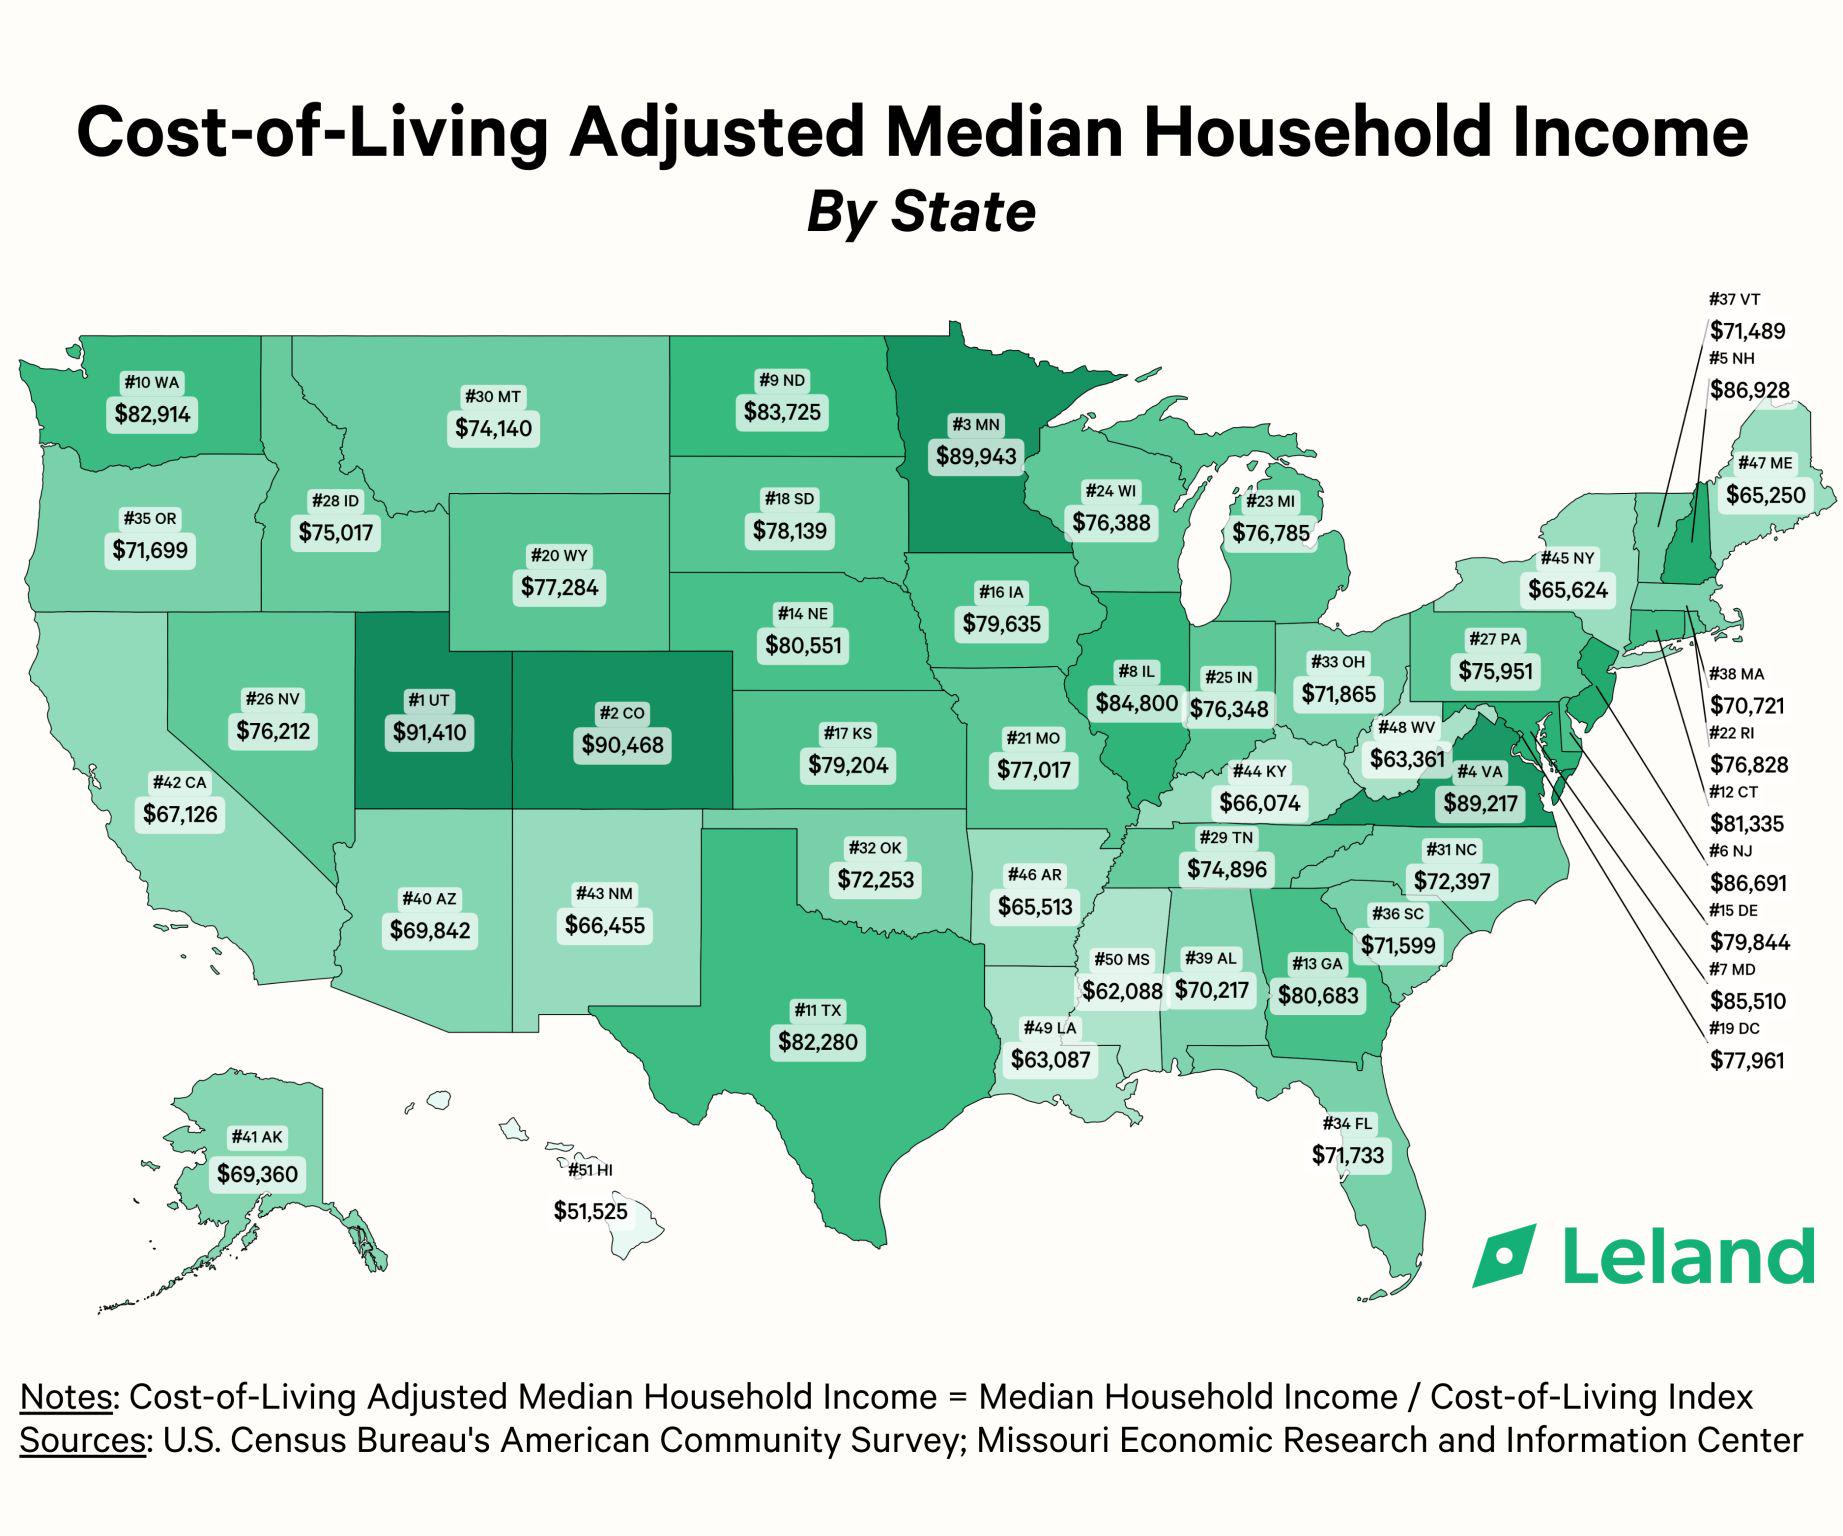
Cost-Of-Living Adjusted Median Household Income (By State) Visualization
This data visualization displays "Cost-Of-Living Adjusted Median Household Income (By State)" and provides a clear visua...
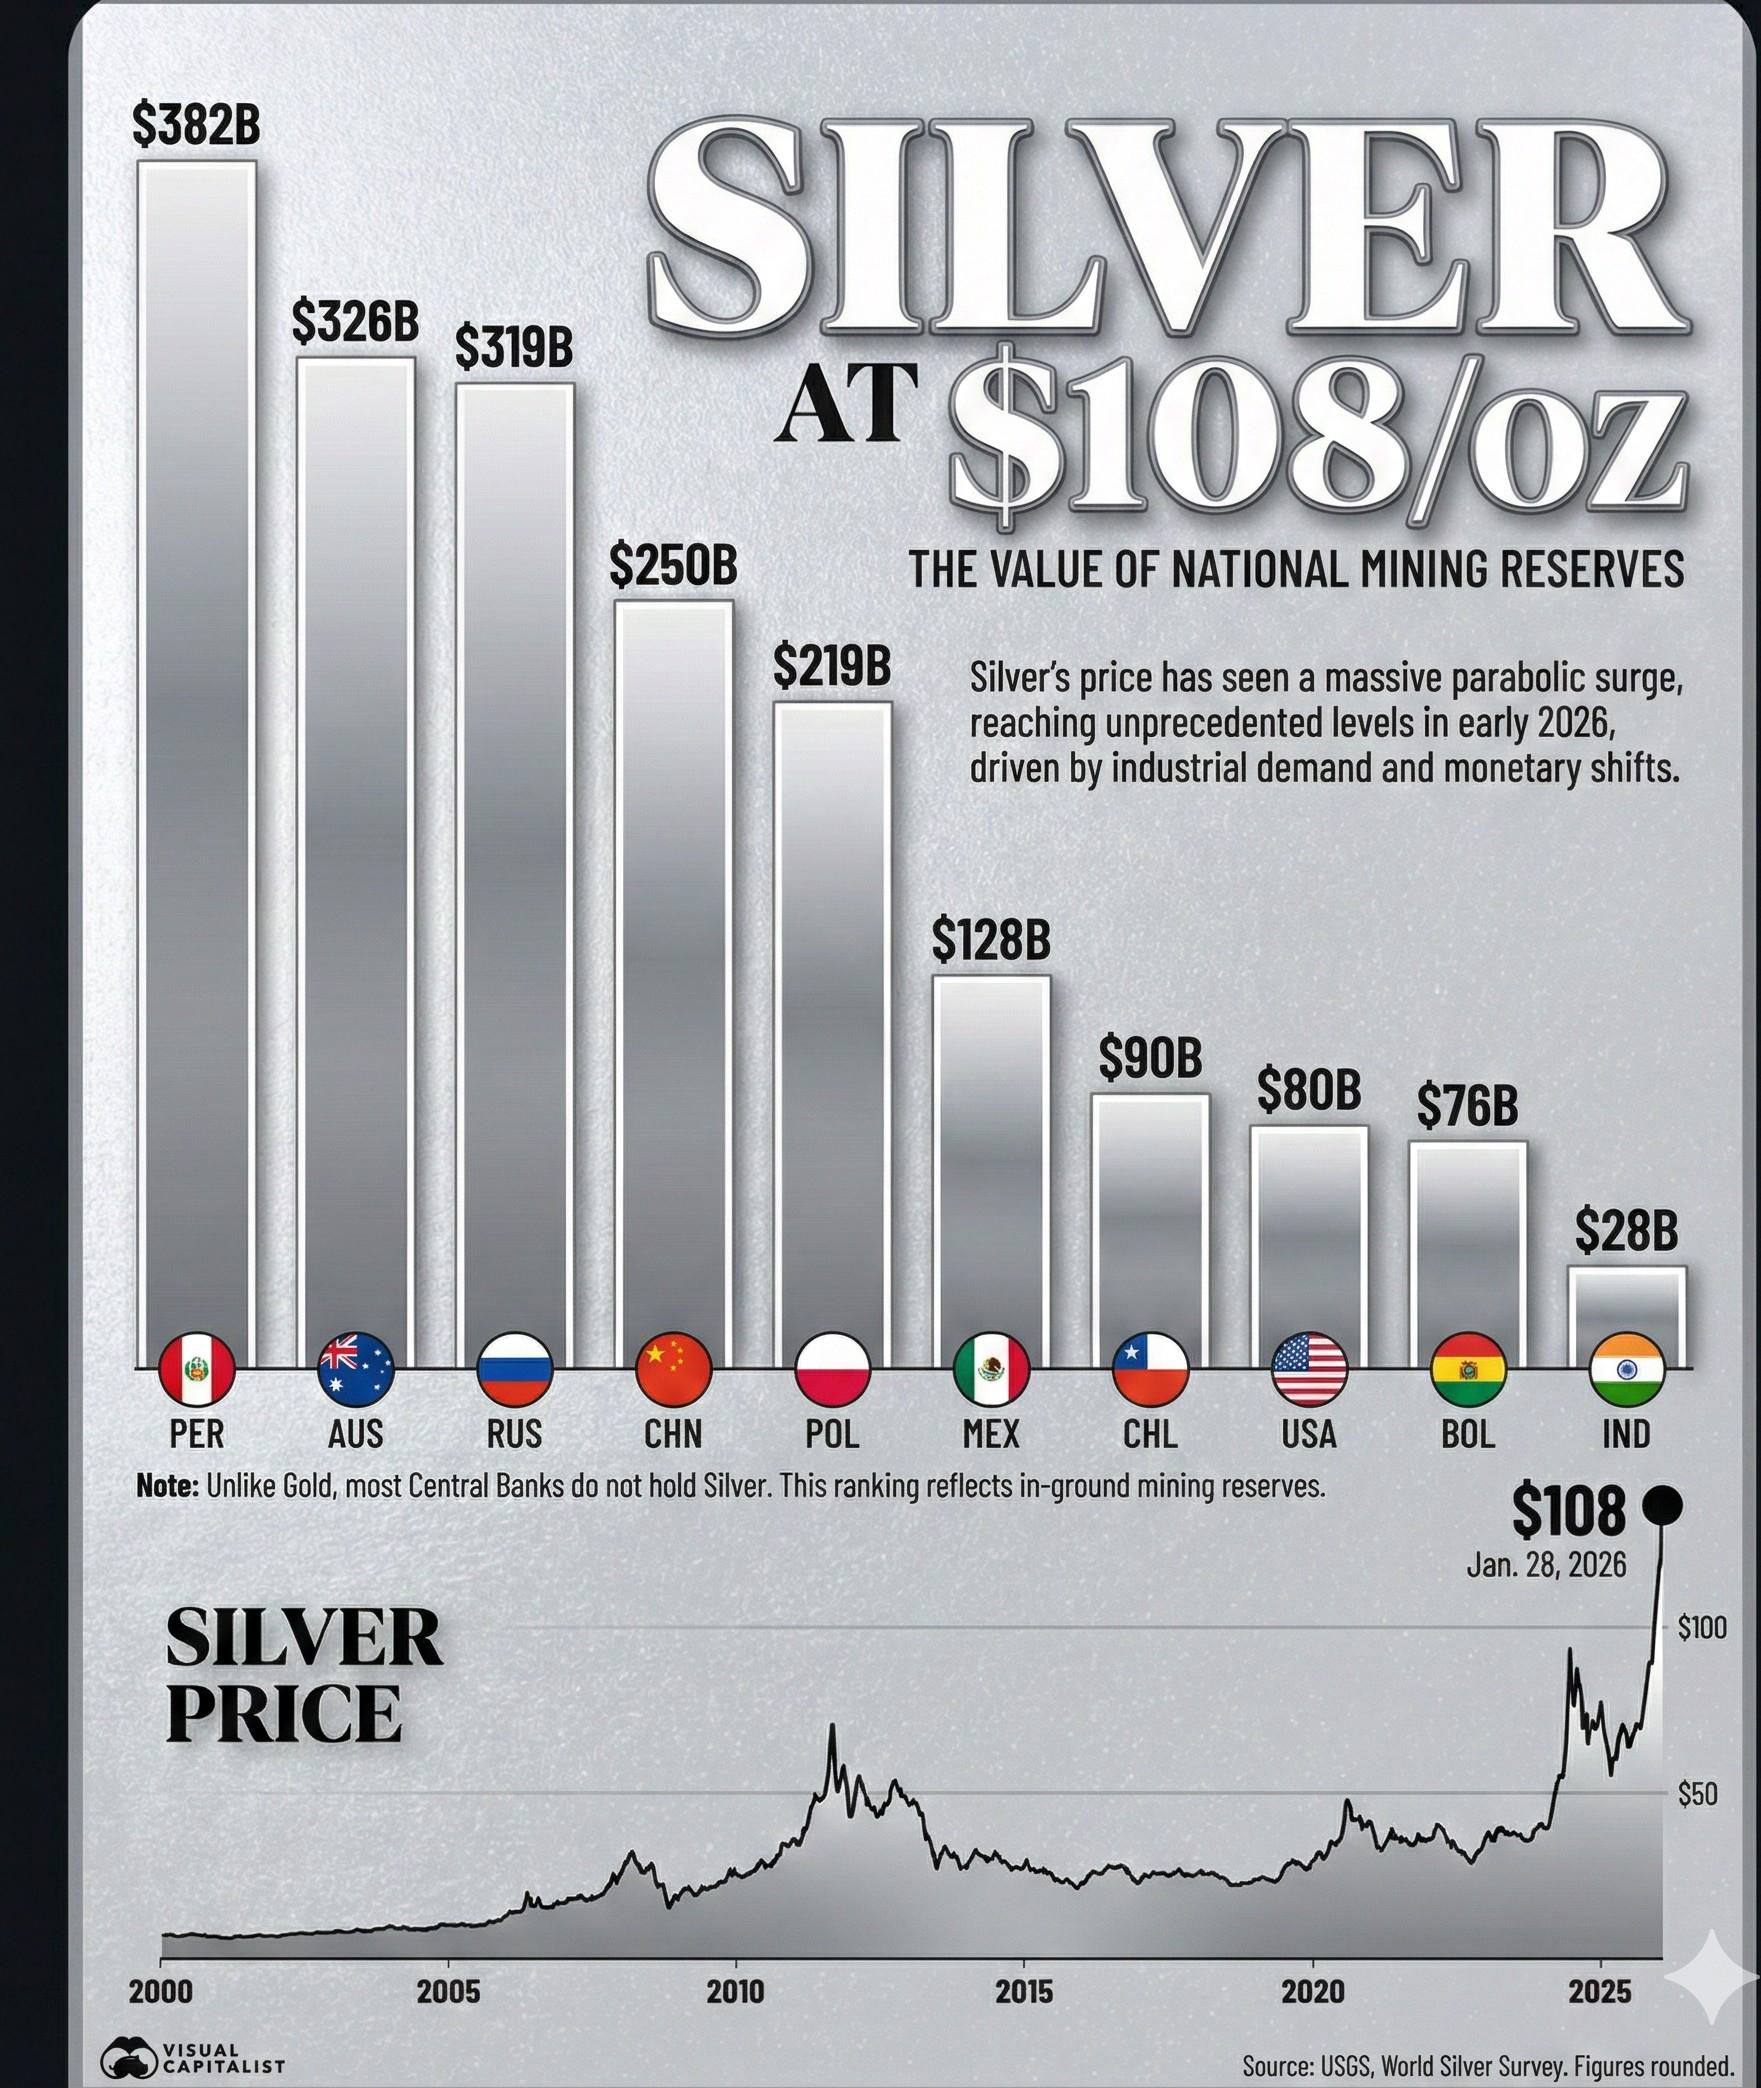
Ranked: Nations by the value of their Silver reserves at $108 and ounce Visualization
This data visualization displays "Ranked: Nations by the value of their Silver reserves at $108 and ounce" and provides ...
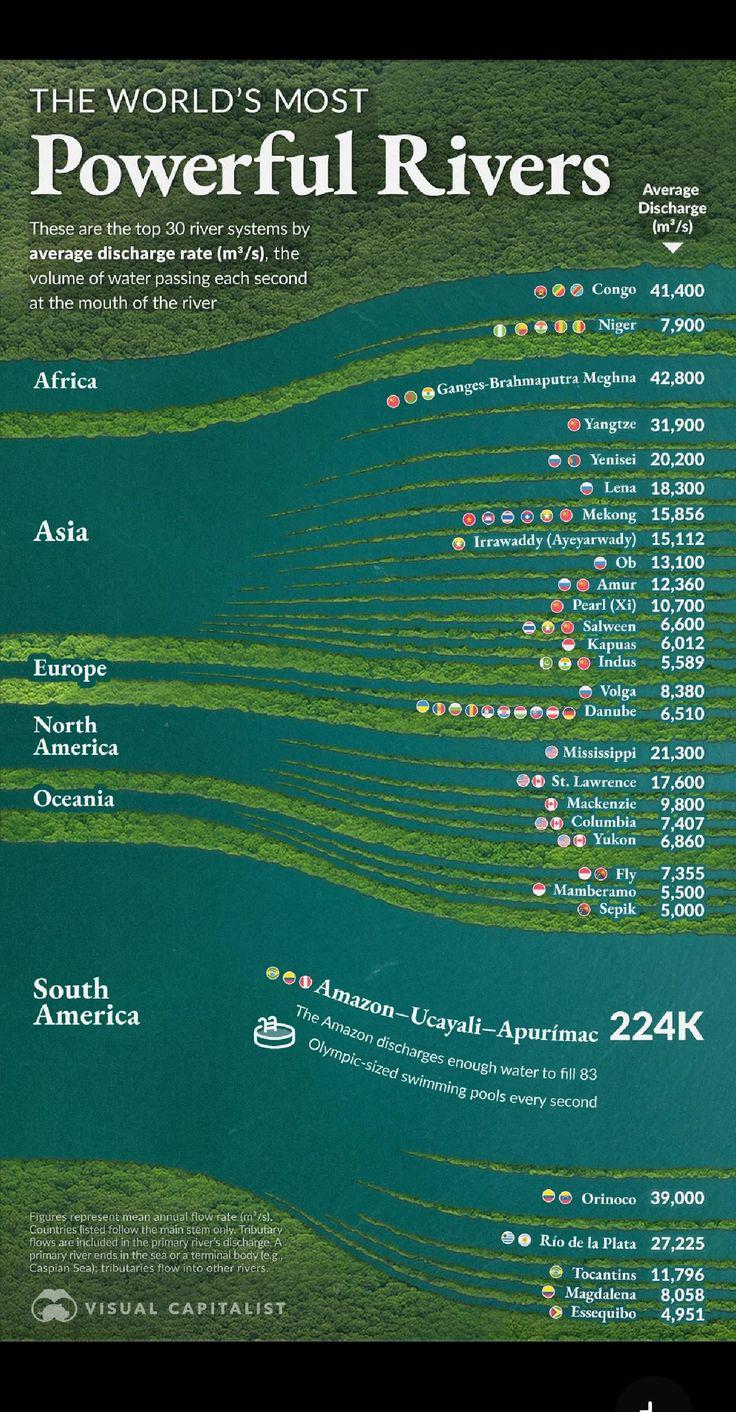
Top 30 River Systems by Average Discharge Rate Visualization
This data visualization displays "Top 30 River Systems by Average Discharge Rate" and provides a clear visual representa...
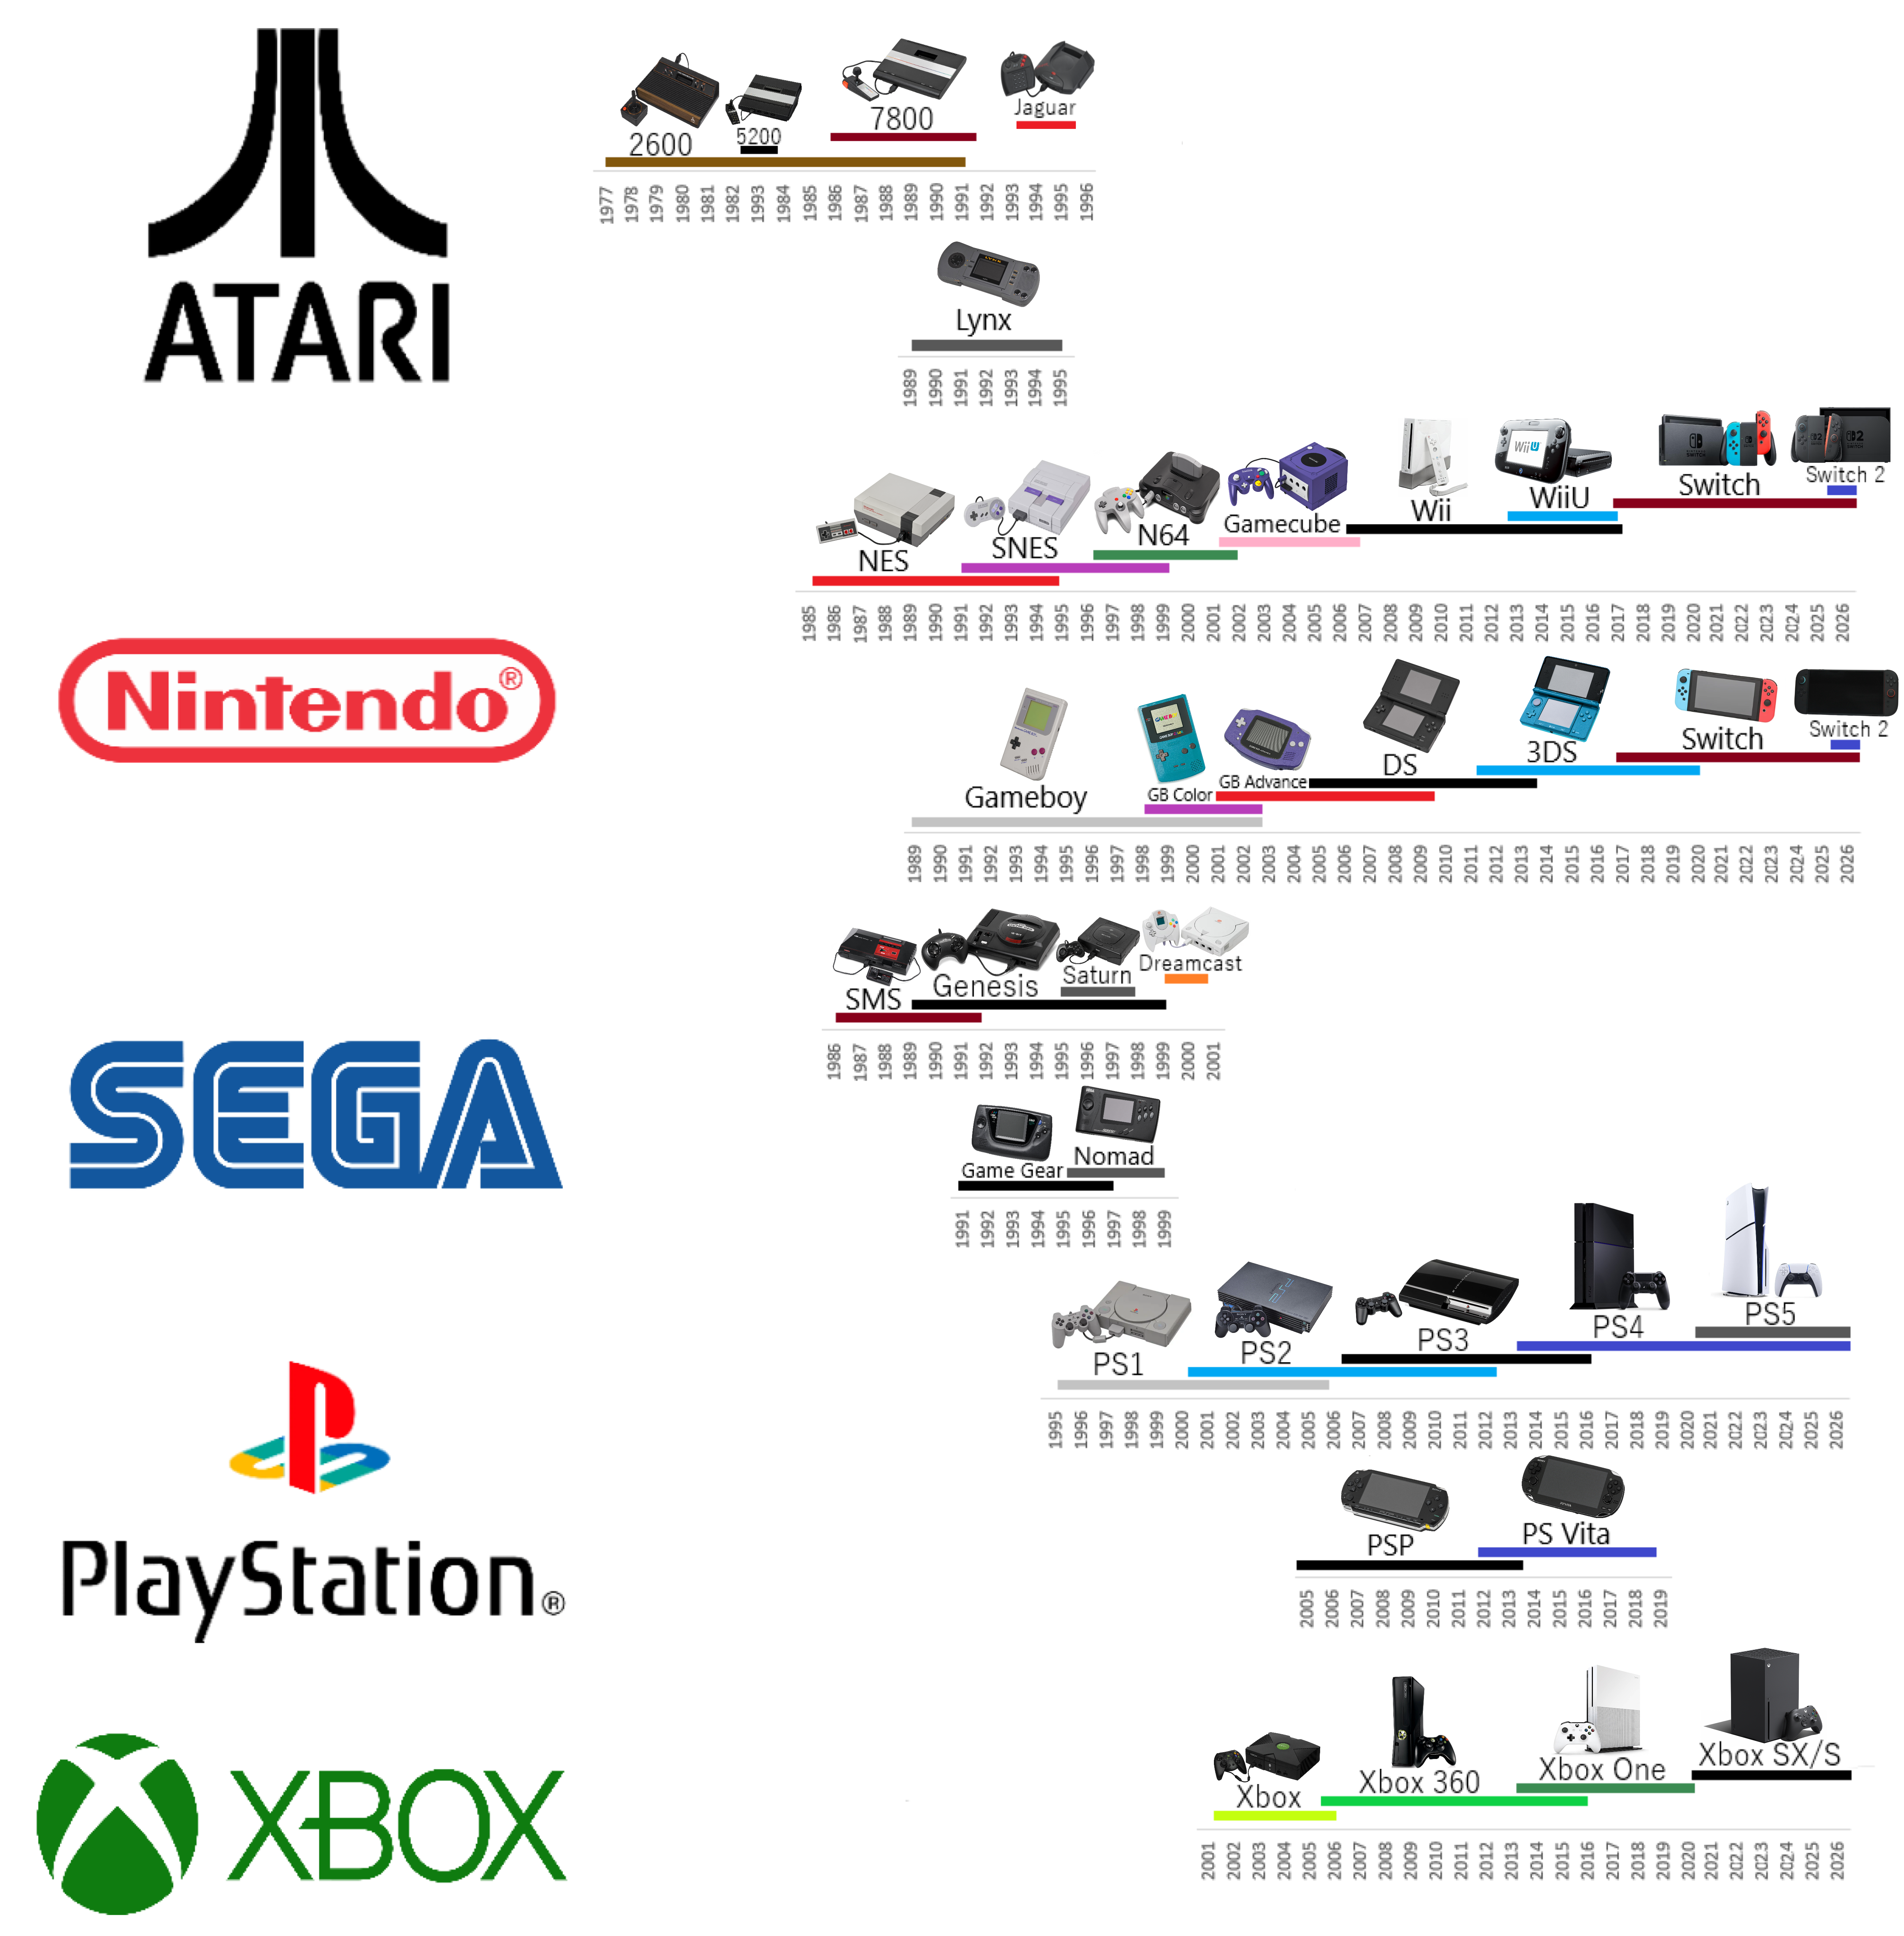
Videogame consoles original sale lifespans in North America 1977-Present Visualization
This data visualization displays "Videogame consoles original sale lifespans in North America 1977-Present" and provides...
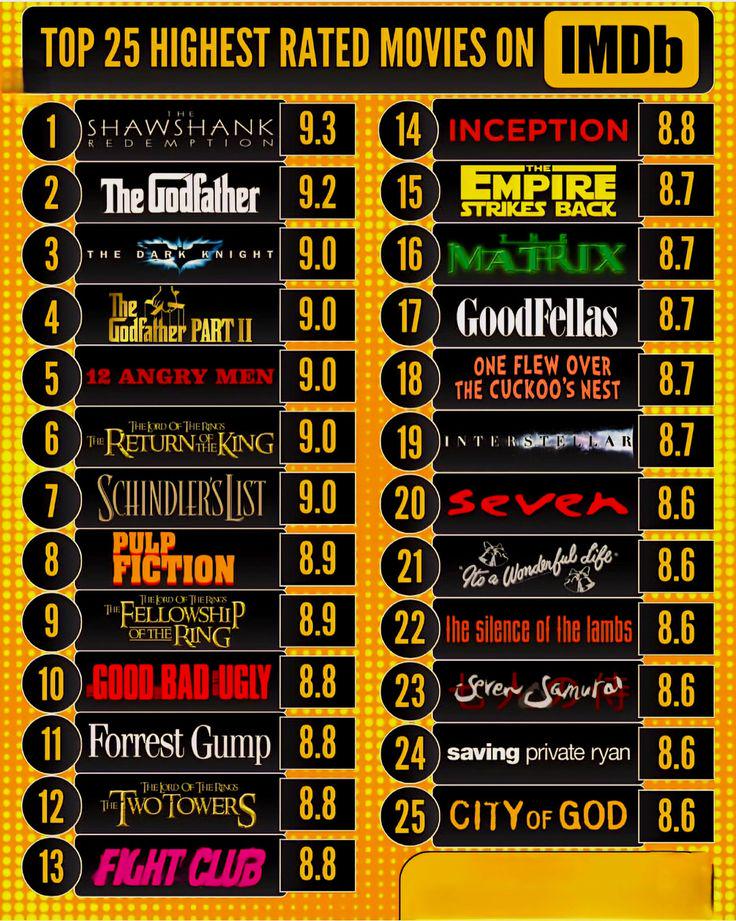
Top 25 Highest Rated Movies on IMDb Visualization
This data visualization displays "Top 25 Highest Rated Movies on IMDb" and provides a clear visual representation of the...
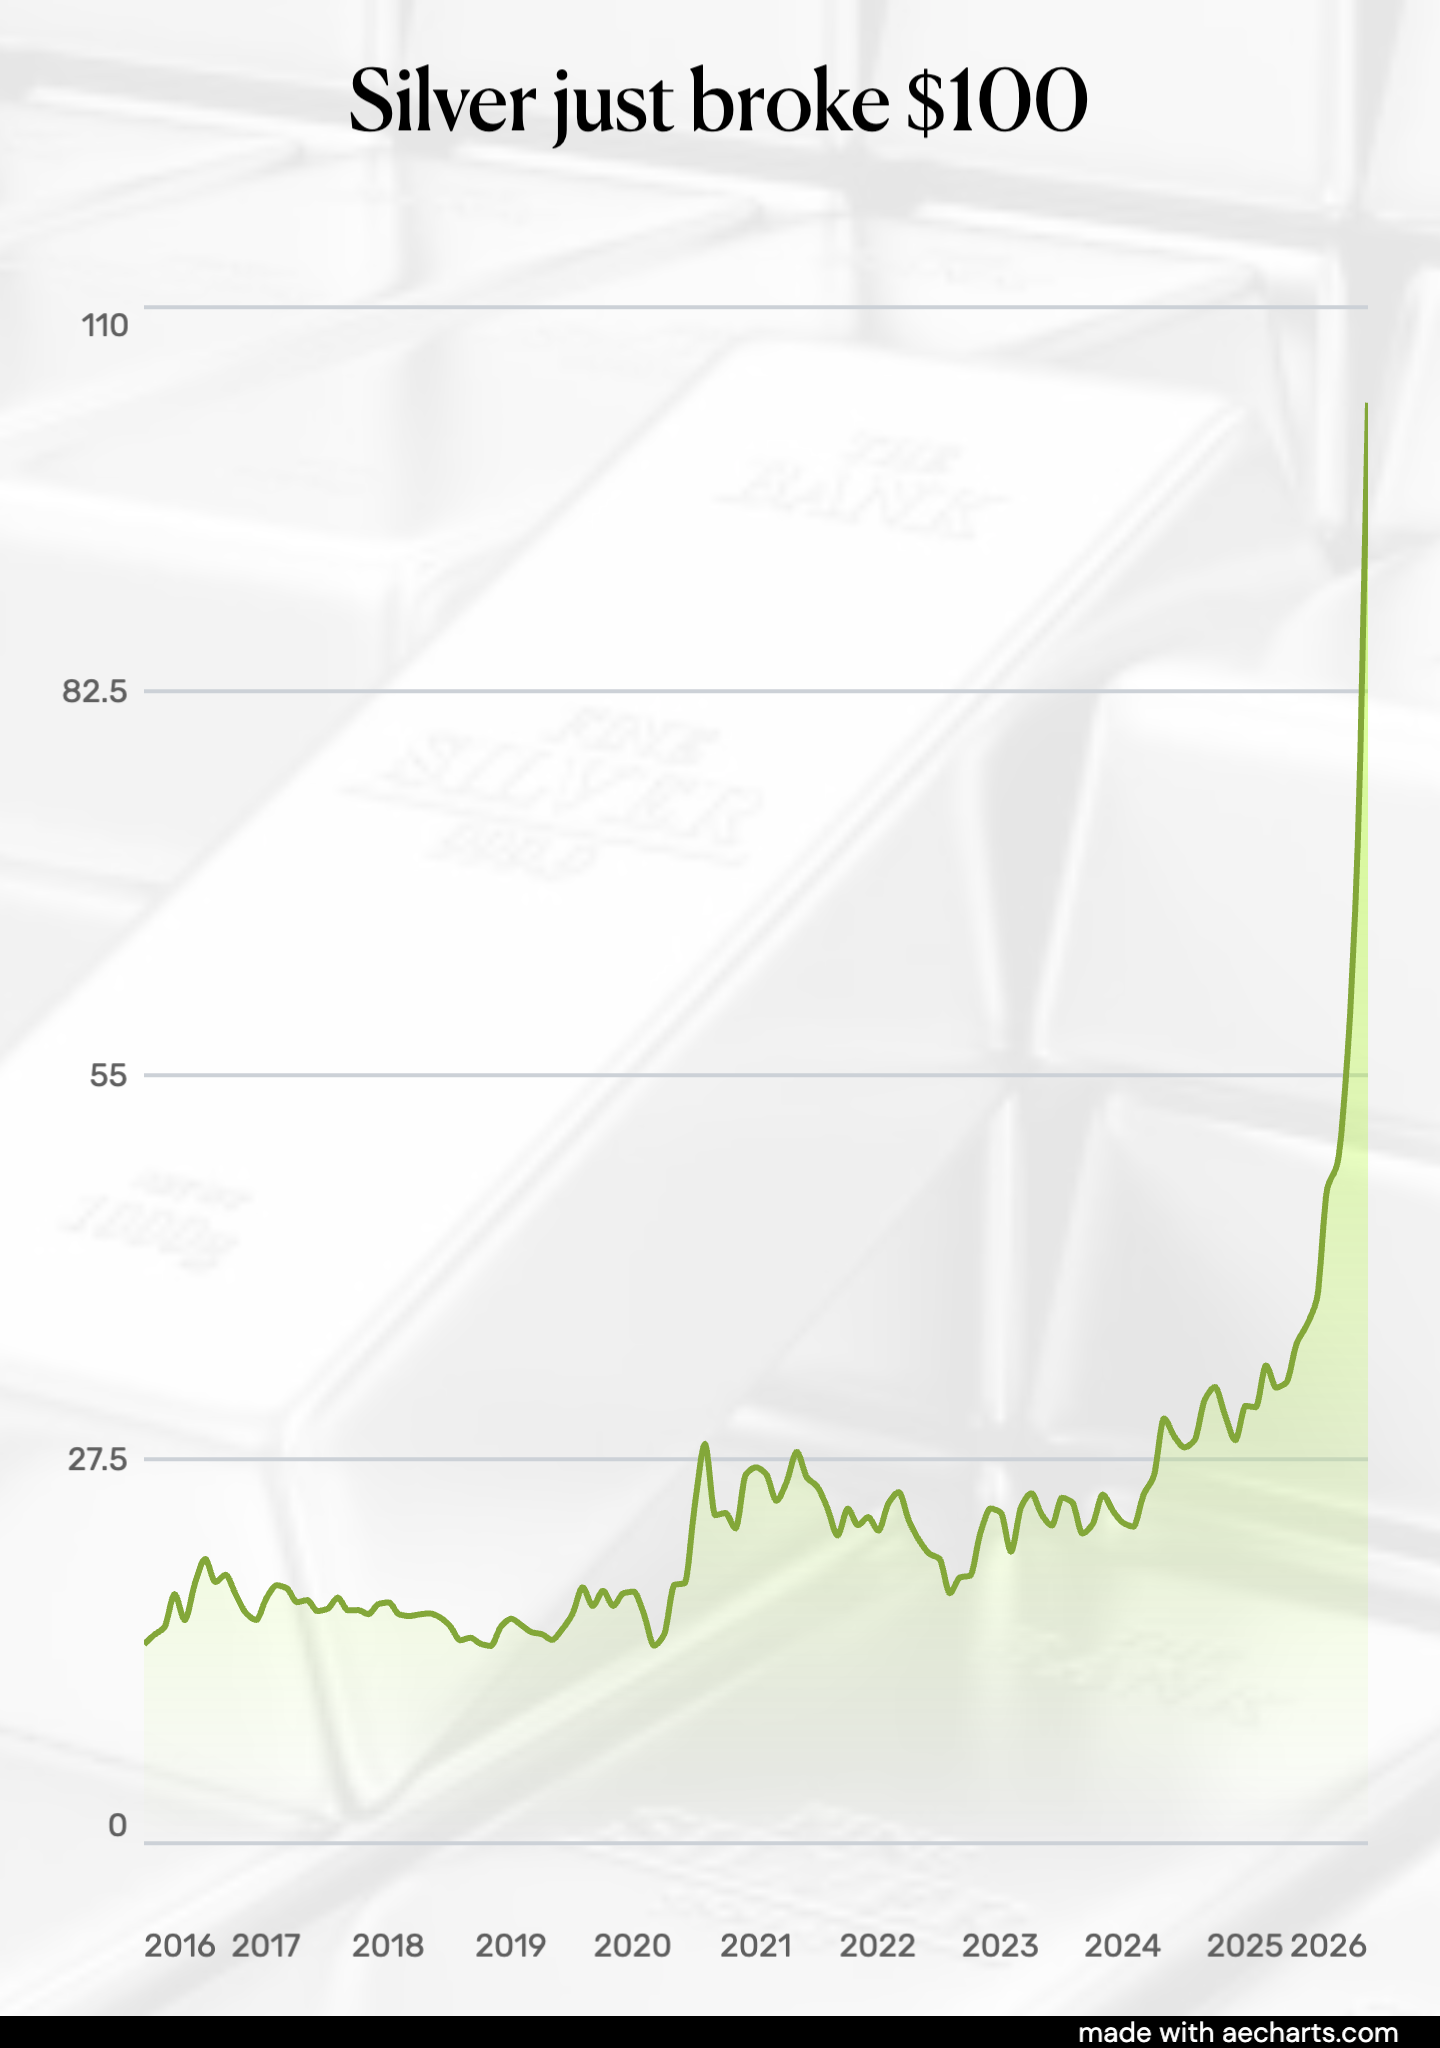
Silver just broke $100 — here’s 10 years that led to this Visualization
This data visualization displays "Silver just broke $100 — here’s 10 years that led to this" and provides a clear visual...
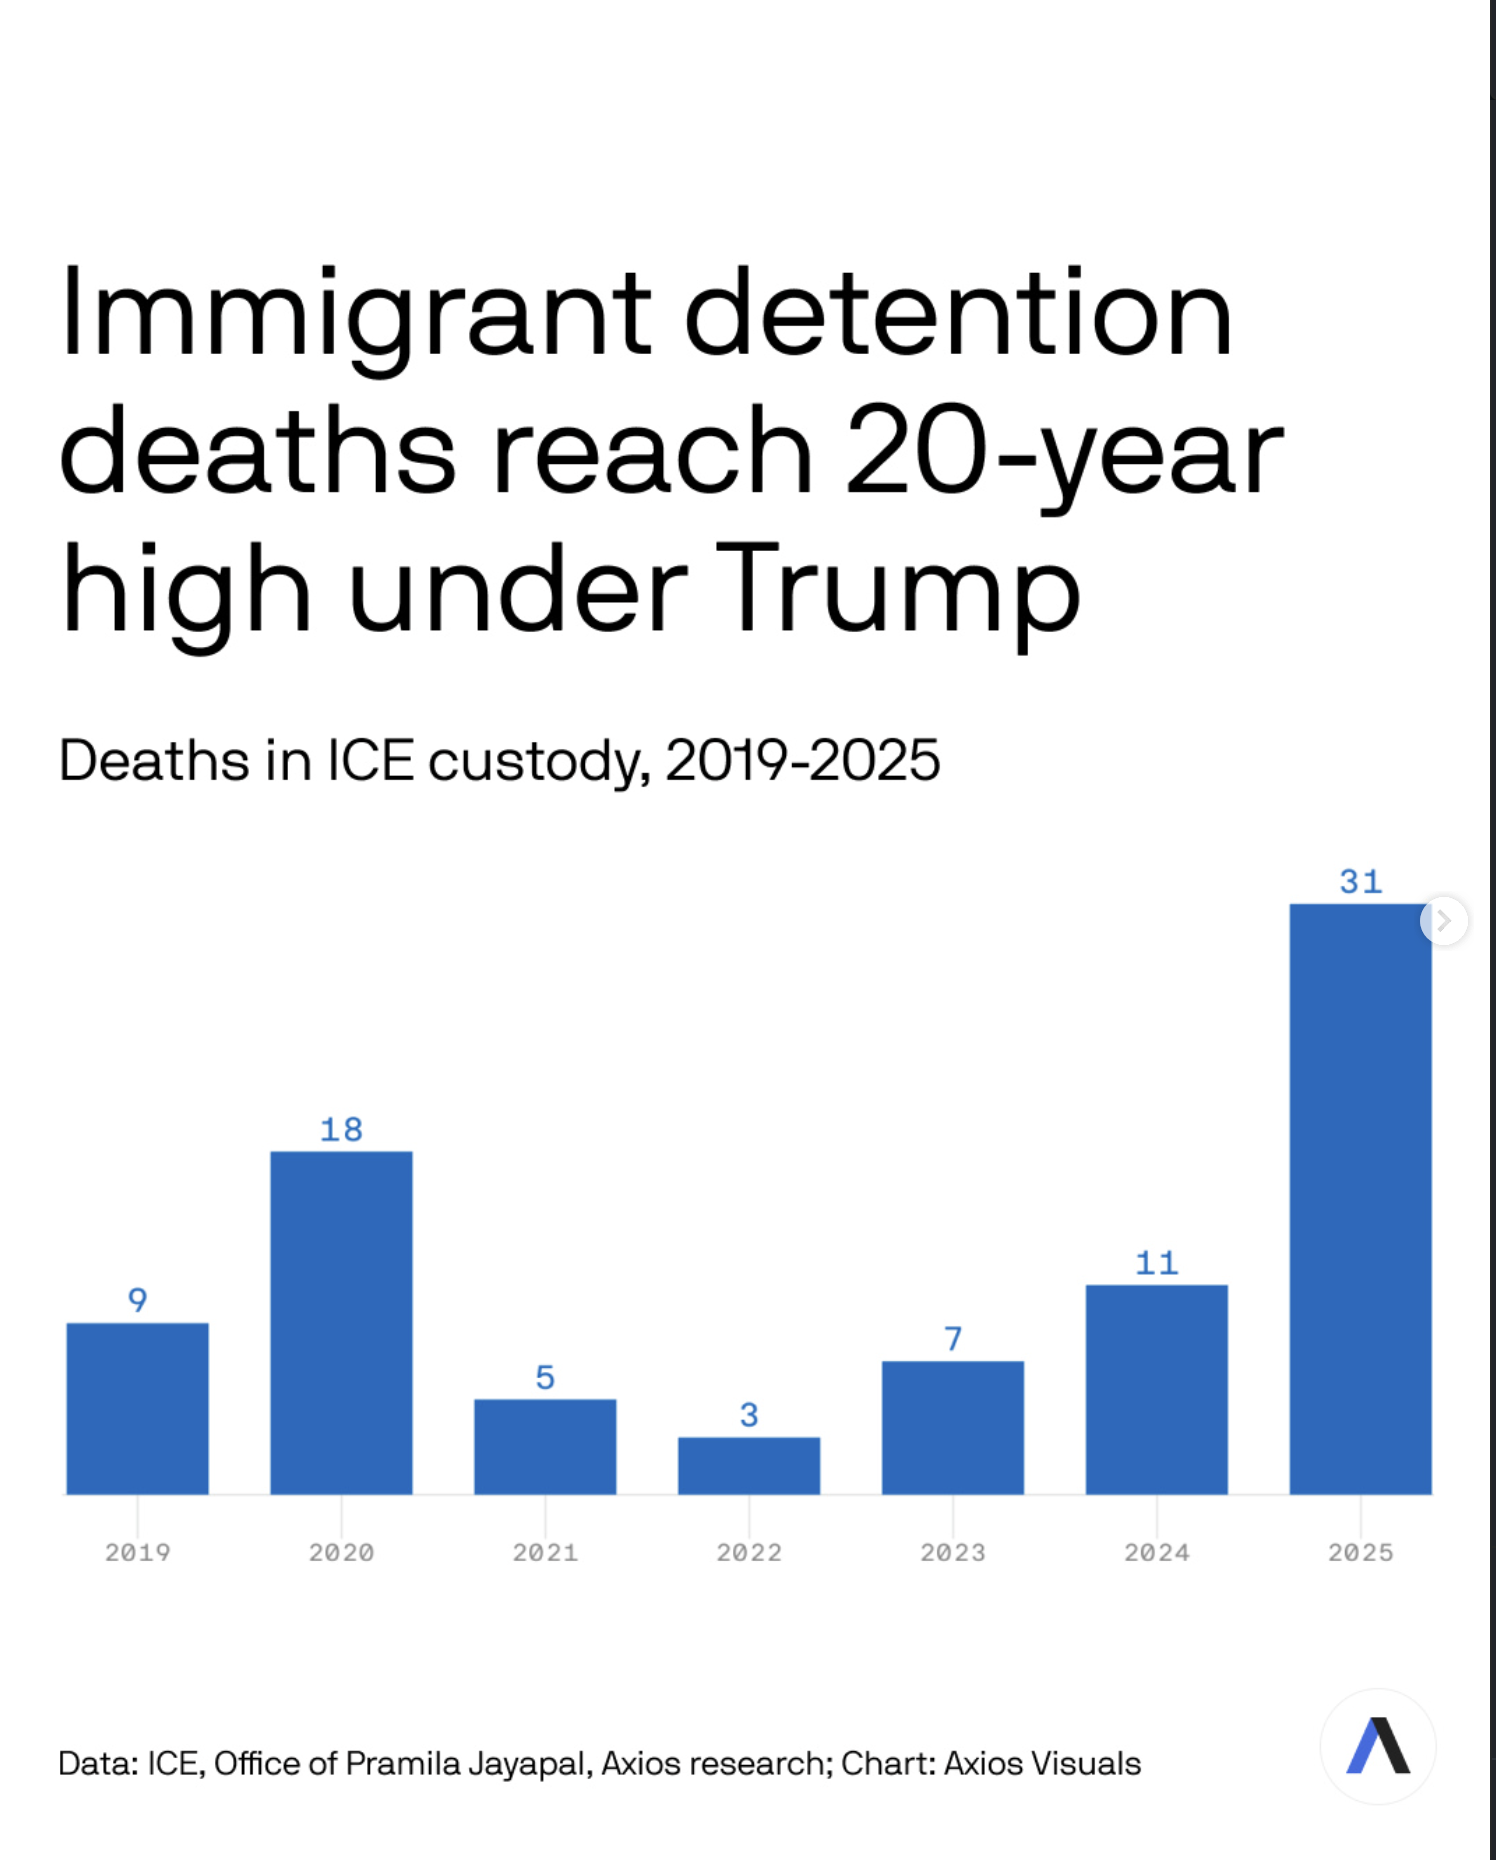
At least 31 people died in ICE custody last year, a two-decade high, as President Trump's mass-detention surge strains a system already under fire for dangerous conditions. Visualization
This data visualization displays "At least 31 people died in ICE custody last year, a two-decade high, as President Trum...
![[OC] Rural areas offer a $45k salary premium for doctors but only attract 1 in 10 Visualization [OC] Rural areas offer a $45k salary premium for doctors but only attract 1 in 10 Visualization](/api/images/reddit-maps/1qqrjgl_1769738401280.jpg)
[OC] Rural areas offer a $45k salary premium for doctors but only attract 1 in 10 Visualization
This data visualization displays "[OC] Rural areas offer a $45k salary premium for doctors but only attract 1 in 10" and...
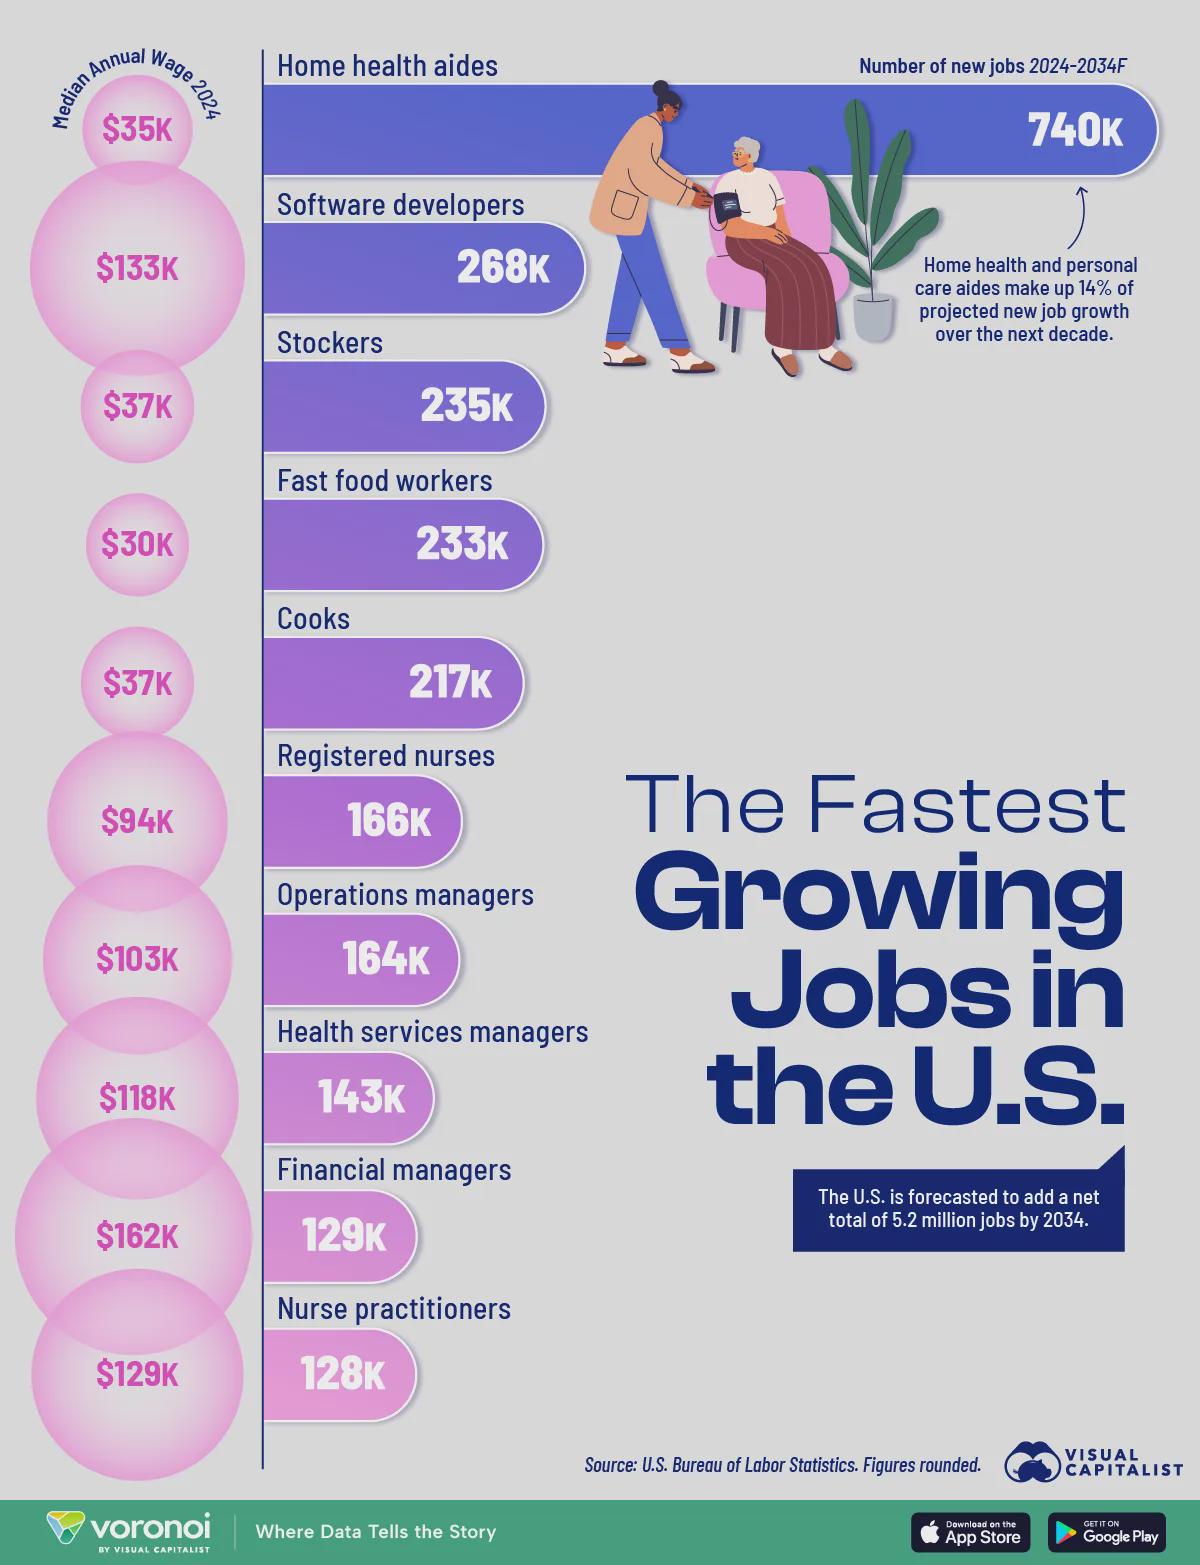
Ranked: The Fastest Growing Jobs in the U.S. Visualization
This data visualization displays "Ranked: The Fastest Growing Jobs in the U.S." and provides a clear visual representati...

Number of S&P 500 CEOs by Undergrad Institution Visualization
This data visualization displays "Number of S&P 500 CEOs by Undergrad Institution" and provides a clear visual repre...
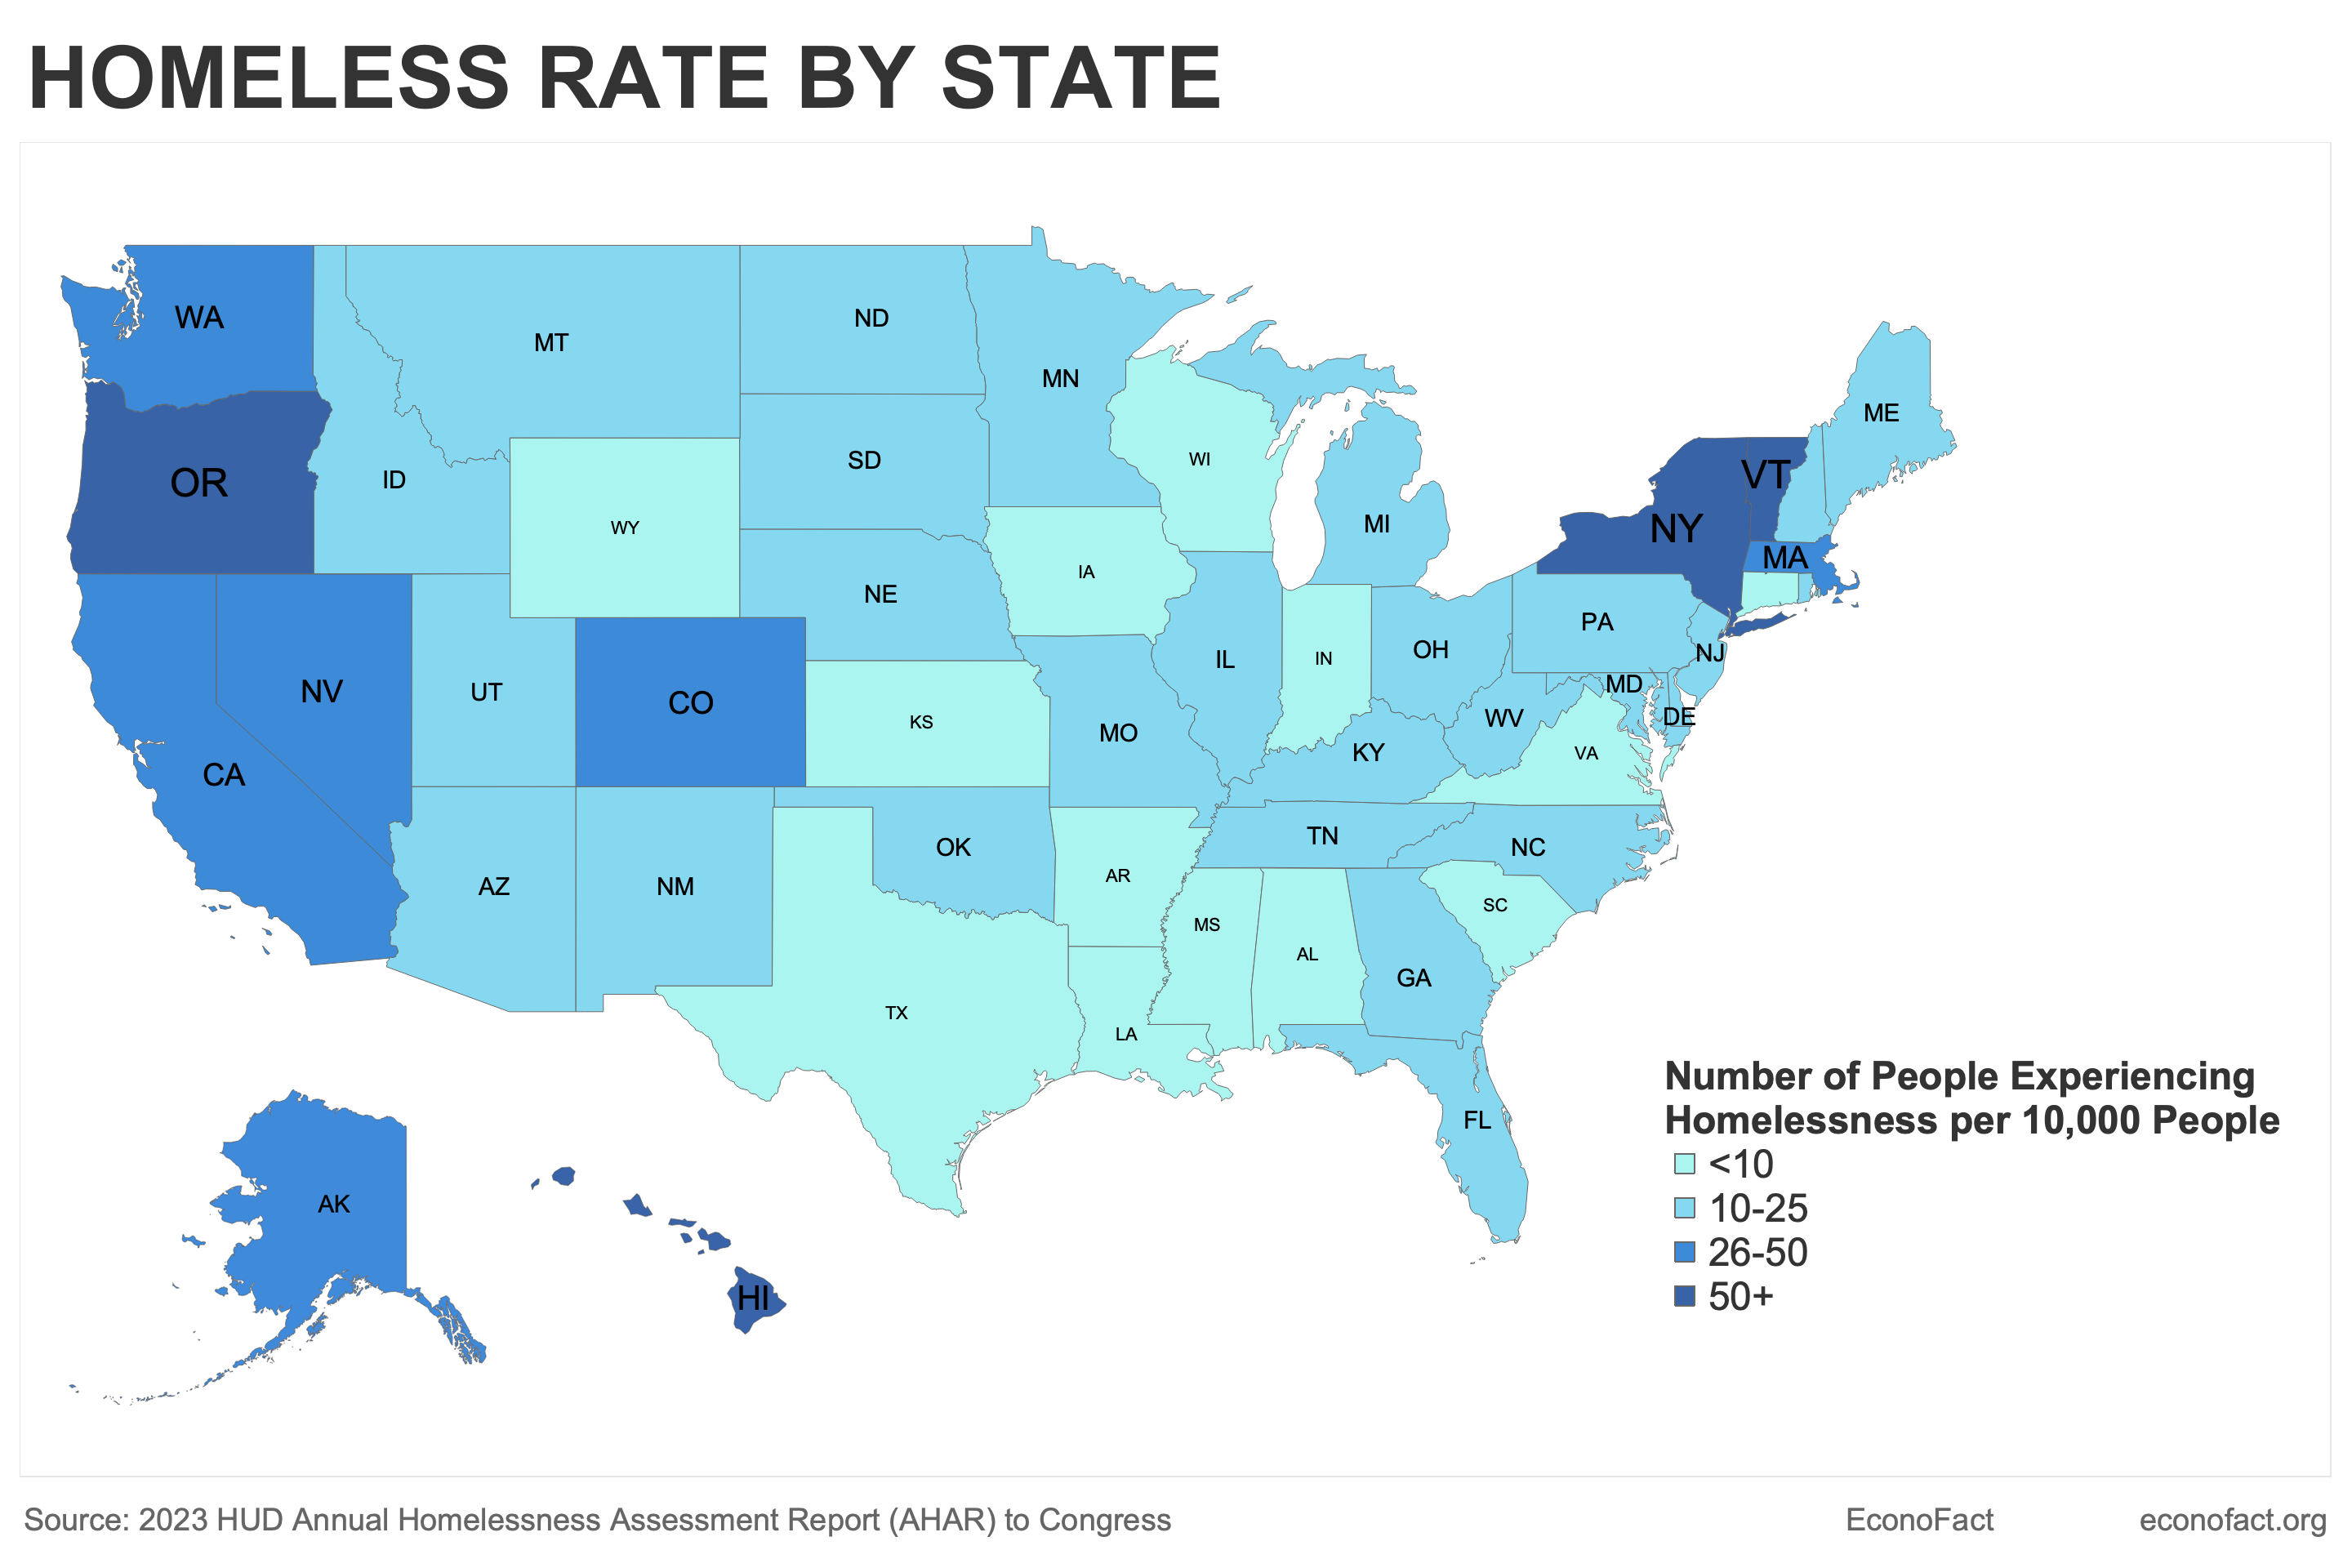
Mapped: Homelessness by State Visualization
This data visualization displays "Mapped: Homelessness by State" and provides a clear visual representation of the under...
![[OC] Landcover Map of Mexico for the year 2000 Visualization [OC] Landcover Map of Mexico for the year 2000 Visualization](/api/images/reddit-maps/1qv1hgg_1770148801226.jpg)
[OC] Landcover Map of Mexico for the year 2000 Visualization
This data visualization displays "[OC] Landcover Map of Mexico for the year 2000" and provides a clear visual representa...
![Cost to Renounce Citizenship in Various Countries [OC] Visualization Cost to Renounce Citizenship in Various Countries [OC] Visualization](/api/images/reddit-maps/1qv6lr7_1770163202654.jpg)
Cost to Renounce Citizenship in Various Countries [OC] Visualization
This data visualization displays "Cost to Renounce Citizenship in Various Countries [OC]" and provides a clear visual re...
![[OC] Barrow Locations in Ireland Visualization [OC] Barrow Locations in Ireland Visualization](/api/images/reddit-maps/1qsuttm_1769947201028.jpg)
[OC] Barrow Locations in Ireland Visualization
This data visualization displays "[OC] Barrow Locations in Ireland" and provides a clear visual representation of the un...