The Current State of Germany and China's Trade Relationship Visualization
Data Analysis
What This Visualization Shows
This data visualization displays "The Current State of Germany and China's Trade Relationship" and provides a clear visual representation of the underlying data patterns and trends. The visualization focuses on The recent meeting between German Chancellor Friedrich Merz and Chinese President Xi Jinping in Beijing highlighted a complex transitional phase in bilateral relations. While diplomatic discussions focused on enhancing strategic mutual trust and stabilizing ties amid global uncertainty, the underlying dialogue was heavily driven by significant shifts in international trade dynamics.
For Beijing, maintaining open European markets remains an economic priority as it navigates a prolonged domestic property crisis. For Germany, the focus has shifted toward addressing what leadership views as an uneven playing field in industrial competition.
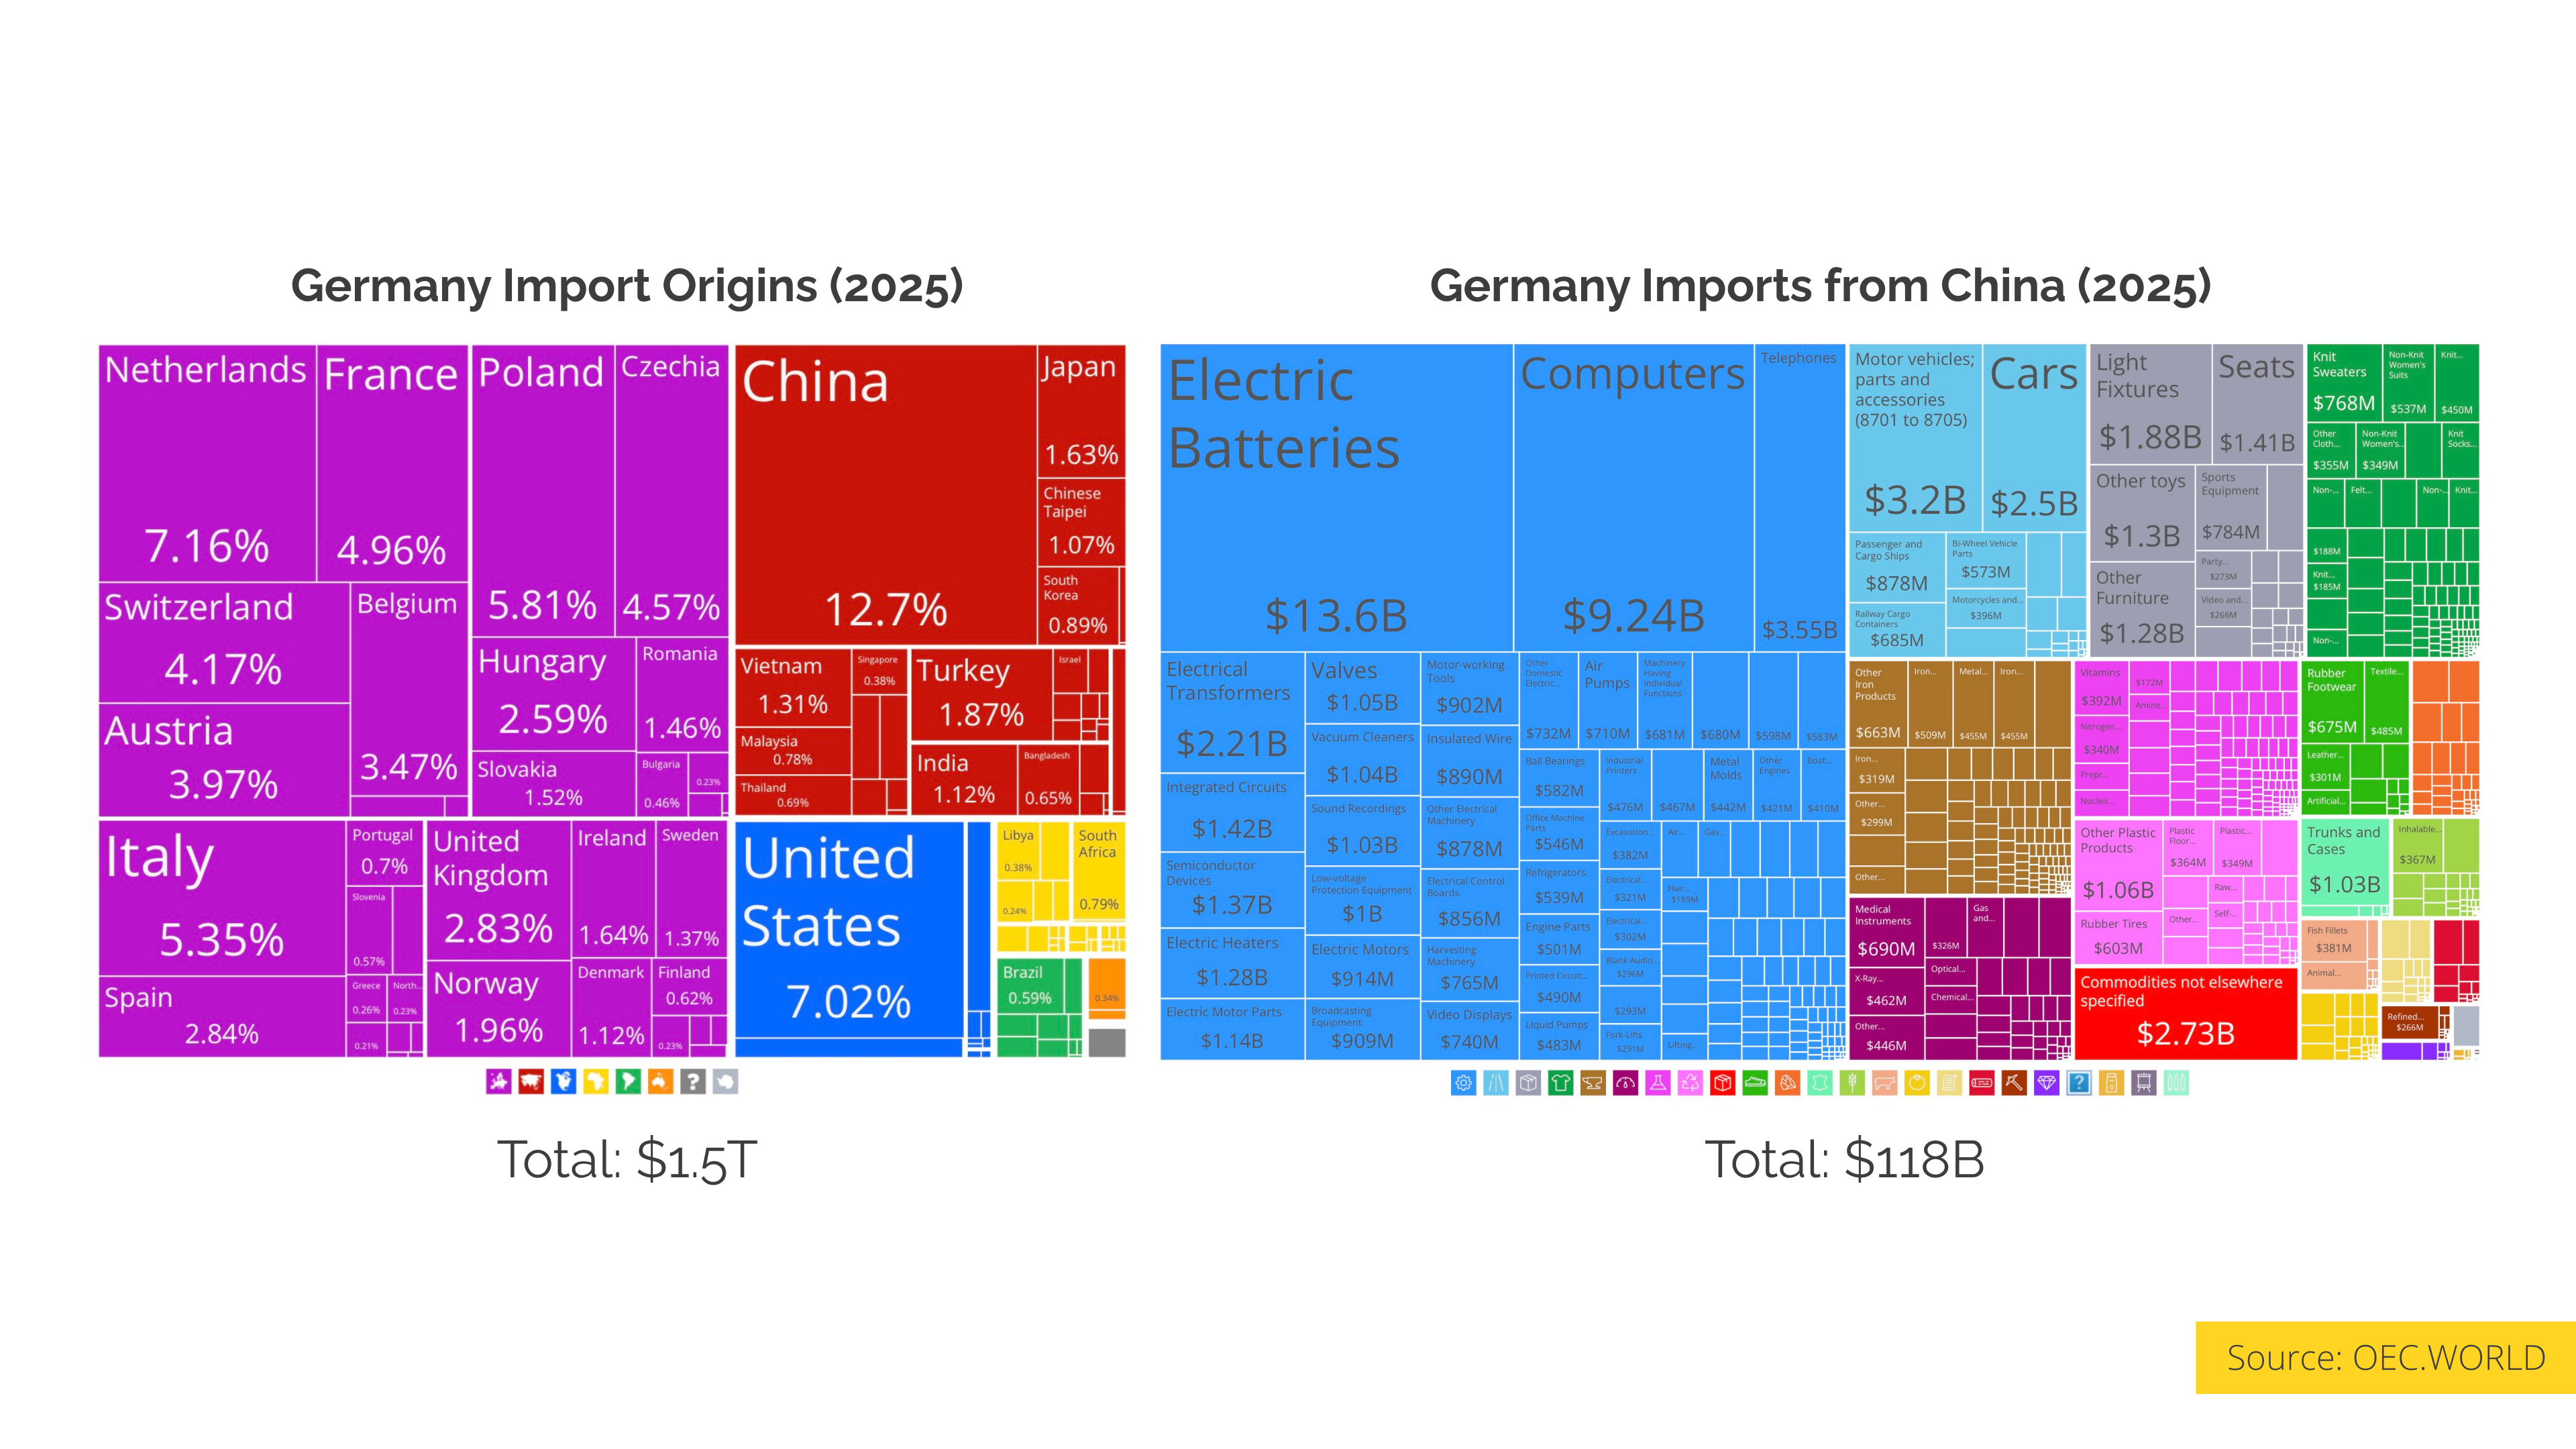
The economic context of Merz's push for "fair competition" becomes clearer when examining recent trade volumes. As of 2025, Germany remains China's largest export destination in Europe, absorbing **$118 billion** in goods. Consequently, China is Germany’s absolute largest source of imports, accounting for **12.7%** of all inbound trade, considerably higher than the United States, which accounts for **7%**.
The most notable shifts are occurring within sectors that historically represent the backbone of the German economy. Between 2022 and 2025, Chinese imports of electric batteries into Germany surged from **$7.99 billion** to **$13.6 billion**. Over the same three-year period, Chinese automobile imports nearly doubled, growing from **$1.31 billion** to **$2.5 billion**.
While Chinese manufacturing continues to gain market share in Europe, the reverse trade flow has noticeably contracted. Compared to 2022, China imported **$18.6 billion less** from Germany in 2025.
This growing disparity provides crucial context for the summit. As Chinese exports in automotive and battery technologies accelerate, traditional German carmakers, chemical producers, and machinery manufacturers are facing intensified global competition. This shift has contributed to a steady erosion of market share for German firms and subsequent industrial job losses domestically, making trade policy a central focus of Germany's diplomatic engagement with Beijing.
**Sources**
* NYT Article: [https://www.nytimes.com/2026/02/25/world/asia/china-germany-merz-visit-xi.html](https://www.nytimes.com/2026/02/25/world/asia/china-germany-merz-visit-xi.html) * China trade data: [https://oec.world/en/profile/country/chn](https://oec.world/en/profile/country/chn) * Germany Data: [https://oec.world/en/profile/country/deu](https://oec.world/en/profile/country/deu), which allows us to understand complex relationships and insights within the data through visual storytelling.
Deep Dive into the Topic
This data visualization represents a sophisticated analysis of complex information patterns that provide valuable insights into underlying trends and relationships. Data visualization serves as a bridge between raw numerical data and human understanding, transforming abstract statistics into comprehensible visual narratives.
The power of data visualization lies in its ability to reveal patterns, outliers, and correlations that might not be apparent in traditional tabular formats. Through careful selection of chart types, color schemes, and interactive elements, effective visualizations can communicate complex information quickly and accurately to diverse audiences.
Modern data visualization combines statistical analysis with design principles to create compelling visual stories. This interdisciplinary approach requires understanding both the underlying data and the cognitive processes involved in visual perception. The result is more effective communication of quantitative insights that can inform decision-making and drive positive change.
Data Analysis and Insights
The patterns revealed in this visualization demonstrate the importance of systematic data analysis in understanding complex phenomena. By examining different data segments, time periods, and categorical breakdowns, we can identify trends that inform strategic planning and decision-making processes.
Statistical analysis of this data reveals variations across different dimensions that provide insights into underlying drivers and relationships. These patterns help identify areas of opportunity, potential risks, and key performance indicators that can guide future actions and resource allocation.
The analytical approach used in this visualization enables comparison across different categories, time periods, or geographic regions, revealing insights that support evidence-based decision-making. This type of analysis is essential for organizations seeking to optimize performance and understand complex market dynamics.
Significance and Applications
This data visualization has important implications for understanding trends and patterns that affect decision-making across multiple sectors. The insights derived from this analysis can inform policy development, business strategy, resource allocation, and operational improvements.
For analysts, researchers, and decision-makers, this type of data visualization provides essential insights for strategic planning and performance optimization. Whether addressing operational challenges, market analysis, or policy development, understanding data patterns helps create more effective strategies and solutions.
The broader significance lies in how this information contributes to our understanding of complex systems and relationships. This knowledge helps predict future trends, identify potential challenges, and develop more informed approaches to problem-solving and opportunity identification.
Comments
Loading comments...
Leave a Comment
About the Author

Alex Cartwright
Senior Data Visualization Expert
Alex Cartwright is a renowned data visualization specialist and infographic designer with over 15 years of experience in...