The 2026 USMCA Joint Review: Why the US is threatening to scrutinize Mexico's $169B+ auto export machine. Visualization
Data Analysis
What This Visualization Shows
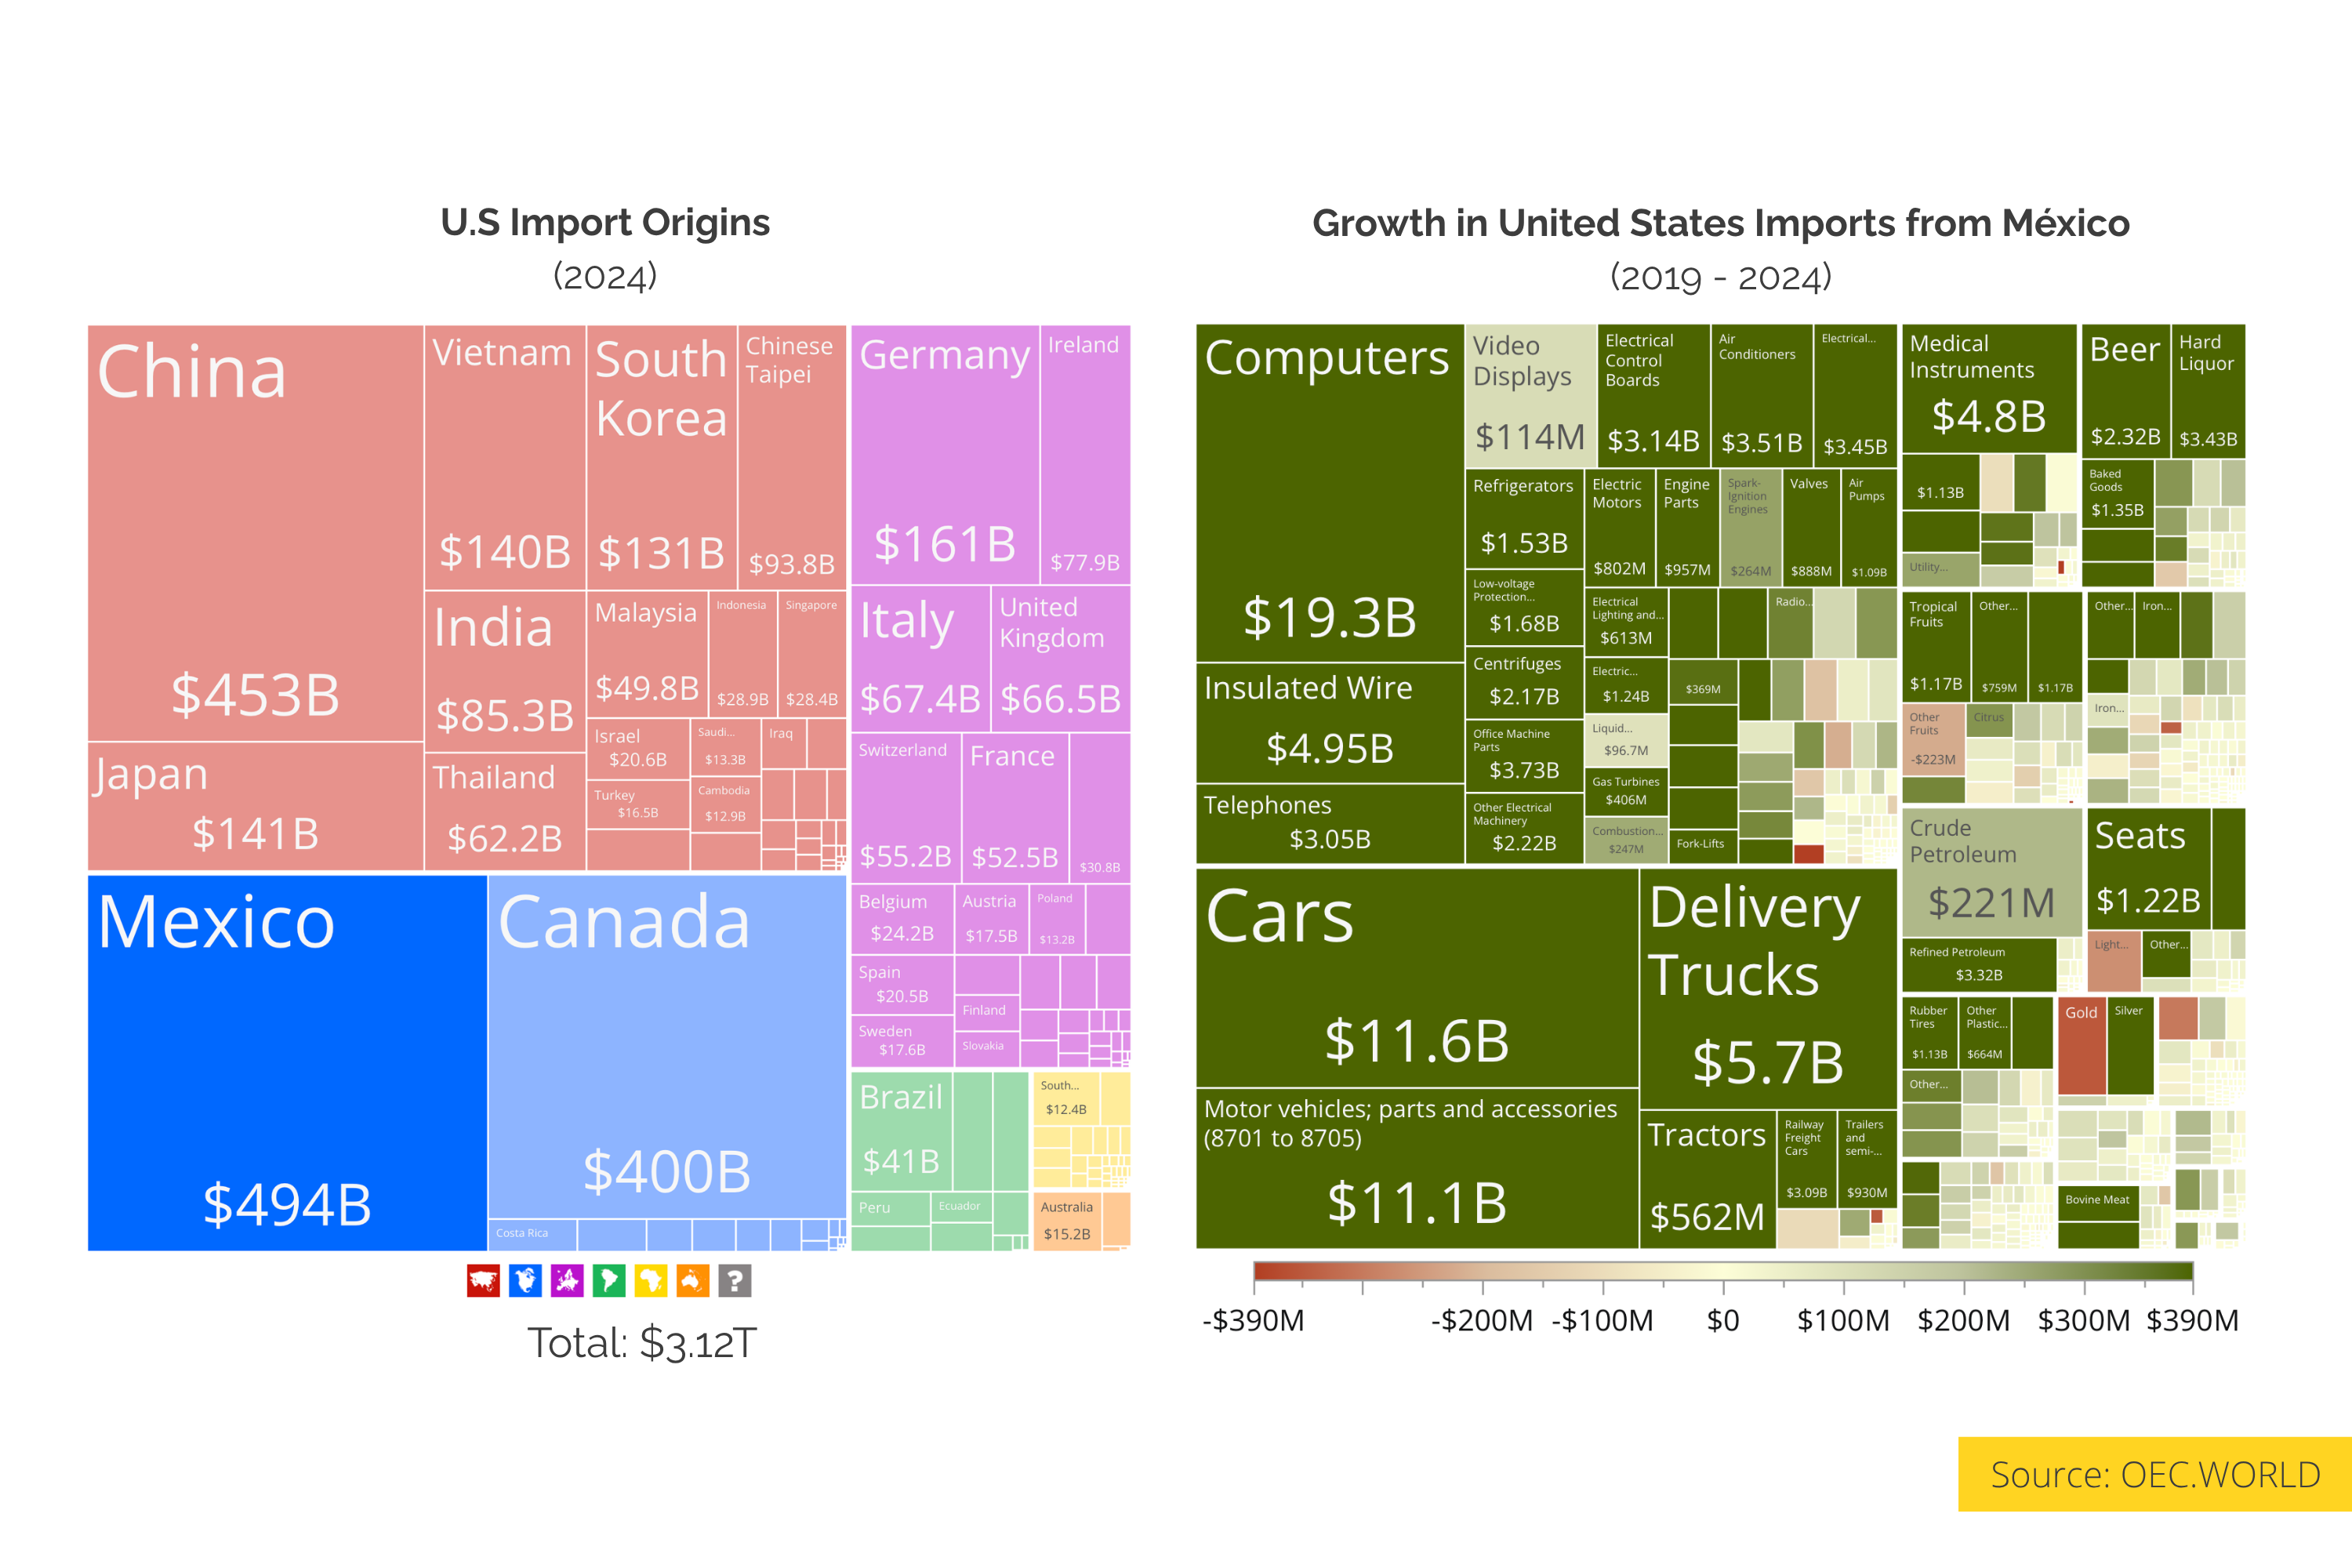
This data visualization displays "The 2026 USMCA Joint Review: Why the US is threatening to scrutinize Mexico's $169B+ auto export machine." and provides a clear visual representation of the underlying data patterns and trends. The visualization focuses on [With the critical 2026 USMCA (US-Mexico-Canada Agreement) "sunset" joint review currently dominating trade discussions](https://www.brookings.edu/articles/unfulfilled-promises-why-the-usmca-joint-review-must-deliver-for-workers/), US and Mexican trade representatives are clashing over a massive issue: Chinese auto parts and EVs allegedly using Mexico as a backdoor into the US market.
According to OEC trade data, Mexico is an absolute powerhouse in the North American auto network. Out of Mexico's total exports to the United States, which reached $535 billion in 2025, the automotive sector is one of the most relevant industries
The profound interconnection between the two nations is undeniable, with Mexico exporting roughly $44.4 billion in cars, $35 billion in vehicle parts, and $34.1 billion in delivery trucks to the US in 2025. Furthermore, over the past 5 years, there has been tremendous growth in Mexico's exported automotive products to the United States, highlighted by $11.6 billion in growth for cars, $11.1 billion for motor vehicle parts and accessories, and $5.7 billion for delivery trucks. These categories do not just represent standalone products; they are a core engine of Mexico's industrial economy and are deeply intertwined with the US vehicle market.
However, the friction comes from the other side of the Pacific. Over the last few years, Mexico's imports of vehicle parts and electrical machinery (which includes EV batteries) from China have surged dramatically. This has sparked intense bipartisan alarm in Washington. [As the US Trade Representative (USTR) has repeatedly emphasized in current discussions, enforcing strict "rules of origin" is non-negotiable.](https://mexicobusiness.news/trade-and-investment/news/united-states-targets-tighter-rules-origin-under-usmca) Furthermore, the [Alliance for American Manufacturing recently issued a stark warning](https://www.americanmanufacturing.org/press-release/icymi-why-chinese-autos-could-be-an-extinction-level-event-for-americas-auto-industry/) that heavily subsidized Chinese autos entering via Mexico would be an "extinction-level event" for the US auto industry.
The data highlights exactly why the US is spooked: Mexico's assembly lines are increasingly running on Chinese components. Because these cross-border supply chains are so closely interdependent, any failure to verify that cars crossing the southern border are genuinely "North American" could trigger the agreement's sunset clause during the 2026 review. Ultimately, this would risk bringing back punishing tariffs and completely upending the continent's manufacturing supply chain, demonstrating exactly why preserving the integrity of this trade deal is so critical.
Data Source: [https://oec.world/en/profile/country/usa?selector343id=Import&selector358id=tradeValue&selector704id=growth\_5&selector303id=Year&selector322id=tradeValue&selector1603id=period\_3&selector335id=HS4&selector320id=1](https://oec.world/en/profile/country/usa?selector343id=Import&selector358id=tradeValue&selector704id=growth_5&selector303id=Year&selector322id=tradeValue&selector1603id=period_3&selector335id=HS4&selector320id=1), which allows us to understand complex relationships and insights within the data through visual storytelling.
Deep Dive into the Topic
This data visualization represents a sophisticated analysis of complex information patterns that provide valuable insights into underlying trends and relationships. Data visualization serves as a bridge between raw numerical data and human understanding, transforming abstract statistics into comprehensible visual narratives.
The power of data visualization lies in its ability to reveal patterns, outliers, and correlations that might not be apparent in traditional tabular formats. Through careful selection of chart types, color schemes, and interactive elements, effective visualizations can communicate complex information quickly and accurately to diverse audiences.
Modern data visualization combines statistical analysis with design principles to create compelling visual stories. This interdisciplinary approach requires understanding both the underlying data and the cognitive processes involved in visual perception. The result is more effective communication of quantitative insights that can inform decision-making and drive positive change.
Data Analysis and Insights
The patterns revealed in this visualization demonstrate the importance of systematic data analysis in understanding complex phenomena. By examining different data segments, time periods, and categorical breakdowns, we can identify trends that inform strategic planning and decision-making processes.
Statistical analysis of this data reveals variations across different dimensions that provide insights into underlying drivers and relationships. These patterns help identify areas of opportunity, potential risks, and key performance indicators that can guide future actions and resource allocation.
The analytical approach used in this visualization enables comparison across different categories, time periods, or geographic regions, revealing insights that support evidence-based decision-making. This type of analysis is essential for organizations seeking to optimize performance and understand complex market dynamics.
Significance and Applications
This data visualization has important implications for understanding trends and patterns that affect decision-making across multiple sectors. The insights derived from this analysis can inform policy development, business strategy, resource allocation, and operational improvements.
For analysts, researchers, and decision-makers, this type of data visualization provides essential insights for strategic planning and performance optimization. Whether addressing operational challenges, market analysis, or policy development, understanding data patterns helps create more effective strategies and solutions.
The broader significance lies in how this information contributes to our understanding of complex systems and relationships. This knowledge helps predict future trends, identify potential challenges, and develop more informed approaches to problem-solving and opportunity identification.
Comments
Loading comments...
Leave a Comment
About the Author

Alex Cartwright
Senior Data Visualization Expert
Alex Cartwright is a renowned data visualization specialist and infographic designer with over 15 years of experience in...