Comparison of messaging apps’ data collection practices based on Apple App Store disclosures Comparison
Data Analysis
What This Visualization Shows
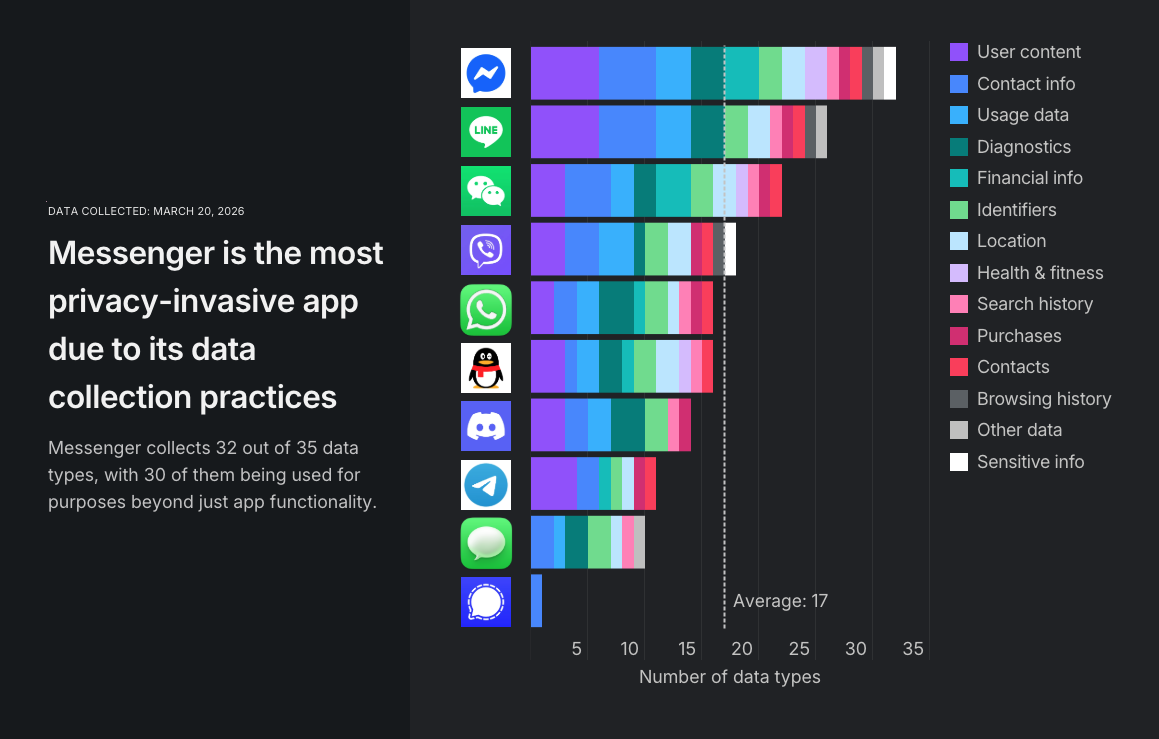
This data visualization displays "Comparison of messaging apps’ data collection practices based on Apple App Store disclosures" and provides a clear visual representation of the underlying data patterns and trends. The visualization focuses on Hello, everyone! This time, we've looked at the most popular messaging apps to see how well each one actually protects your privacy and keeps your data secure.
**Methodology and sources**
For this study, 10 iOS messaging apps were examined: the pre-installed Apple Messages App — which is likely used by most Apple device owners due to its default presence — and the top nine most downloaded apps in 2025, according to data provided by AppMagic. MAX was excluded from the analysis because it is not available in the US Apple App Store, which is used to review app privacy practices. The selection criteria from AppMagic included the category (Social Networking), tag (Messenger), geography (Worldwide), store (iPhone App Store), and year (2025).
To evaluate the privacy practices of these apps, five criteria were selected. First, we examined the type of encryption employed, whether quantum-secure or not. This indicator delves into encryption, prioritizing whether cryptography is quantum-secure rather than just checking for end-to-end encryption. The default layer isn't enough, as quantum threats could potentially break through other encryption methods. That's why only those with quantum-secure levels of security earn the highest score.
Second, we looked at the number of data types the app may collect. This indicator assesses the data collection practices of analyzed apps, scoring them based on how many of the 35 data types listed in the Apple App Store they may collect. Collecting more data types increases privacy risks, for example, in the case of a data breach, which is why a higher number of collected data types leads to a lower score.
However, the total score for the app also includes two additional indicators: one for data collected for tracking purposes and another for data collected that is not related to app functionality. This approach provides a balanced view of data collection practices by not focusing solely on the number of data types collected, acknowledging that some are essential to the app's functionality. And fifth, we evaluated whether the app integrates AI features.
These factors illustrate each app's privacy-related activities and contribute equally to the final score. The scores of each analyzed app were then categorized into five levels, ranging from high to low, to indicate their commitment to user privacy and security.
[For the complete research material behind this study, click here.](https://docs.google.com/spreadsheets/d/1y2-xlH0z5oyRVU0Lx9F0CQUkYBbyS7YsbWwbTwgSVdE/edit?gid=847712438#gid=847712438)
[The full study can be found here. ](https://surfshark.com/research/chart/messaging-apps-privacy), which allows us to understand complex relationships and insights within the data through visual storytelling.
Deep Dive into the Topic
Technology data visualization provides insights into digital trends, user behavior, and system performance that drive innovation and improve user experiences. This field encompasses everything from website analytics and app usage patterns to system performance monitoring and cybersecurity threat visualization.
Digital analytics visualizations help product managers understand user journeys, identify feature adoption patterns, and optimize user interfaces. System performance dashboards enable IT professionals to monitor server health, network traffic, and application response times. Social media and web analytics reveal content engagement patterns, user demographics, and digital marketing effectiveness.
The rapid evolution of technology creates new opportunities for data visualization in emerging fields like artificial intelligence, Internet of Things (IoT), and blockchain analytics. These technologies generate vast amounts of data that require innovative visualization approaches to make them understandable and actionable. Technology data visualization not only helps manage complex systems but also enables the development of better products and services through data-driven insights.
Data Analysis and Insights
The patterns revealed in this visualization demonstrate the importance of systematic data analysis in understanding complex phenomena. By examining different data segments, time periods, and categorical breakdowns, we can identify trends that inform strategic planning and decision-making processes.
Statistical analysis of this data reveals variations across different dimensions that provide insights into underlying drivers and relationships. These patterns help identify areas of opportunity, potential risks, and key performance indicators that can guide future actions and resource allocation.
The analytical approach used in this visualization enables comparison across different categories, time periods, or geographic regions, revealing insights that support evidence-based decision-making. This type of analysis is essential for organizations seeking to optimize performance and understand complex market dynamics.
Significance and Applications
This data visualization has important implications for understanding trends and patterns that affect decision-making across multiple sectors. The insights derived from this analysis can inform policy development, business strategy, resource allocation, and operational improvements.
For analysts, researchers, and decision-makers, this type of data visualization provides essential insights for strategic planning and performance optimization. Whether addressing operational challenges, market analysis, or policy development, understanding data patterns helps create more effective strategies and solutions.
The broader significance lies in how this information contributes to our understanding of complex systems and relationships. This knowledge helps predict future trends, identify potential challenges, and develop more informed approaches to problem-solving and opportunity identification.
Comments
Loading comments...
Leave a Comment
About the Author

Alex Cartwright
Senior Data Visualization Expert
Alex Cartwright is a renowned data visualization specialist and infographic designer with over 15 years of experience in...