data-analysis Maps
42 geographic visualizations tagged with "data-analysis"
![[OC] I turned data on luggage mishandling into a sticker for my suitcase Statistics [OC] I turned data on luggage mishandling into a sticker for my suitcase Statistics](/api/images/reddit-maps/1qppkvh_1769644802322.jpg)
[OC] I turned data on luggage mishandling into a sticker for my suitcase Statistics
This data visualization displays "[OC] I turned data on luggage mishandling into a sticker for my suitcase" and provides...
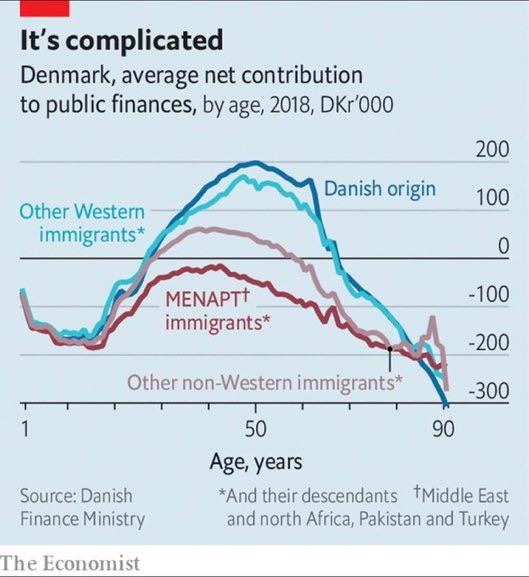
Denmark’s fiscal reality: net contributions to public finances vary wildly by immigrant origin and age (2018 data) Statistics
This data visualization displays "Denmark’s fiscal reality: net contributions to public finances vary wildly by immigran...
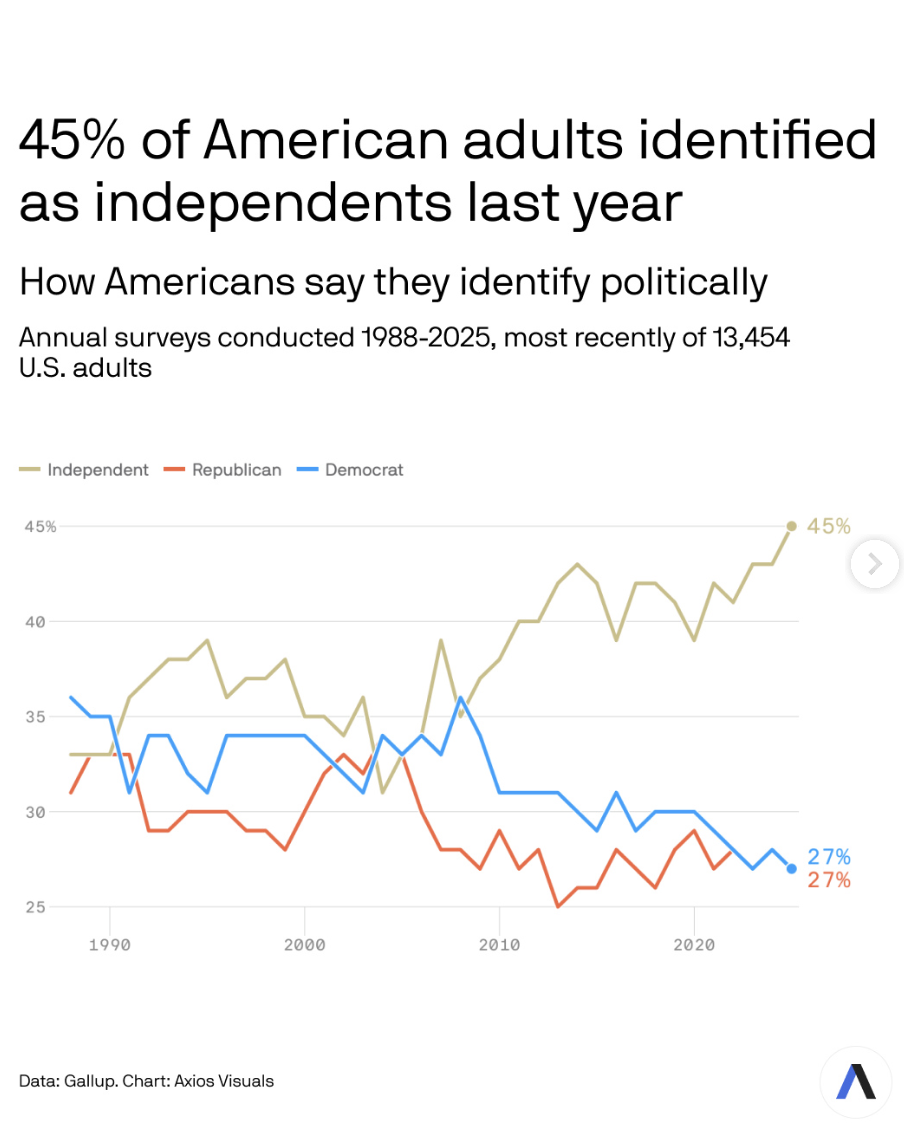
A record 45% of American adults identified as independents last year — an increase driven by millennials and Gen Z, according to new Gallup data. Statistics
This data visualization displays "A record 45% of American adults identified as independents last year — an increase dri...
![[OC] I simulated a $1 bet on 23,250 Solana memecoins using historical data. After accounting for real liquidity and slippage, 99.8% of projects failed, but the top 0.2% "Moonshots" (Gold dots) pushed the total ROI to +340%. Statistics [OC] I simulated a $1 bet on 23,250 Solana memecoins using historical data. After accounting for real liquidity and slippage, 99.8% of projects failed, but the top 0.2% "Moonshots" (Gold dots) pushed the total ROI to +340%. Statistics](/api/images/reddit-maps/1qsb09b_1769889602101.jpg)
[OC] I simulated a $1 bet on 23,250 Solana memecoins using historical data. After accounting for real liquidity and slippage, 99.8% of projects failed, but the top 0.2% "Moonshots" (Gold dots) pushed the total ROI to +340%. Statistics
This data visualization displays "[OC] I simulated a $1 bet on 23,250 Solana memecoins using historical data. After acco...
![[OC] Public transport travel time accessibility in Sofia, Bulgaria (GTFS data) Statistics [OC] Public transport travel time accessibility in Sofia, Bulgaria (GTFS data) Statistics](/api/images/reddit-maps/1qgzbt4_1768816801534.jpg)
[OC] Public transport travel time accessibility in Sofia, Bulgaria (GTFS data) Statistics
This data visualization displays "[OC] Public transport travel time accessibility in Sofia, Bulgaria (GTFS data)" and pr...
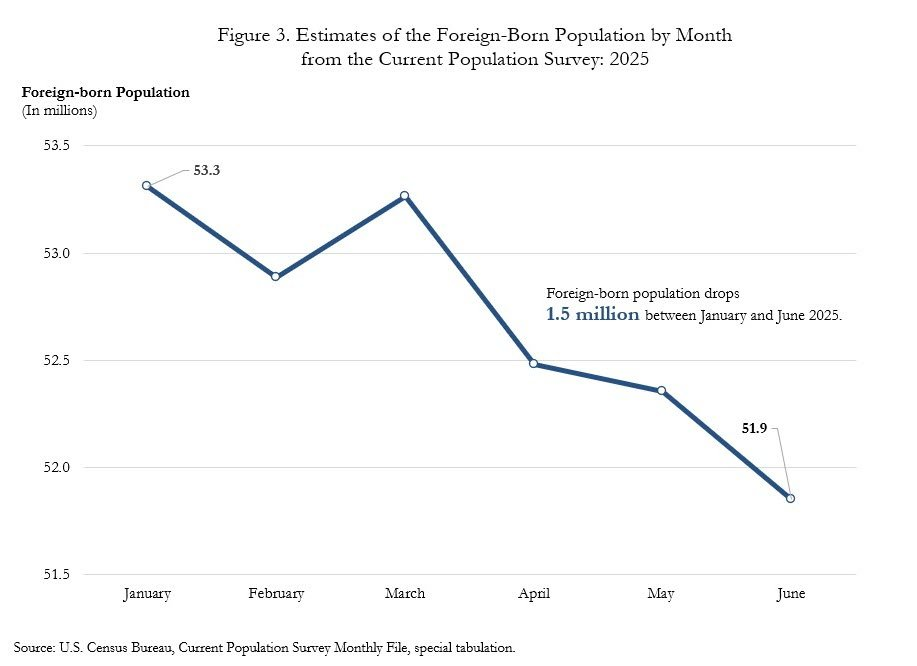
US Census Bureau data shows a 1.5M drop in the foreign-born population residing in the US over the first 6 months of 2025 Data Visualization
This data visualization displays "US Census Bureau data shows a 1.5M drop in the foreign-born population residing in the...
![Looking at 68 years of data to see who really wins Grammy Awards [OC] Statistics Looking at 68 years of data to see who really wins Grammy Awards [OC] Statistics](/api/images/reddit-maps/1qqmtdy_1769731202791.jpg)
Looking at 68 years of data to see who really wins Grammy Awards [OC] Statistics
This data visualization displays "Looking at 68 years of data to see who really wins Grammy Awards [OC]" and provides a ...
![[OC] Empathizing Map: An offline-first PWA for urban navigation (CDMX, MapLibre, PMTiles for vectors & raster data, ~5.8 MB) Statistics [OC] Empathizing Map: An offline-first PWA for urban navigation (CDMX, MapLibre, PMTiles for vectors & raster data, ~5.8 MB) Statistics](/api/images/reddit-maps/1qt3a1n_1769968801160.jpg)
[OC] Empathizing Map: An offline-first PWA for urban navigation (CDMX, MapLibre, PMTiles for vectors & raster data, ~5.8 MB) Statistics
This data visualization displays "[OC] Empathizing Map: An offline-first PWA for urban navigation (CDMX, MapLibre, PMTil...
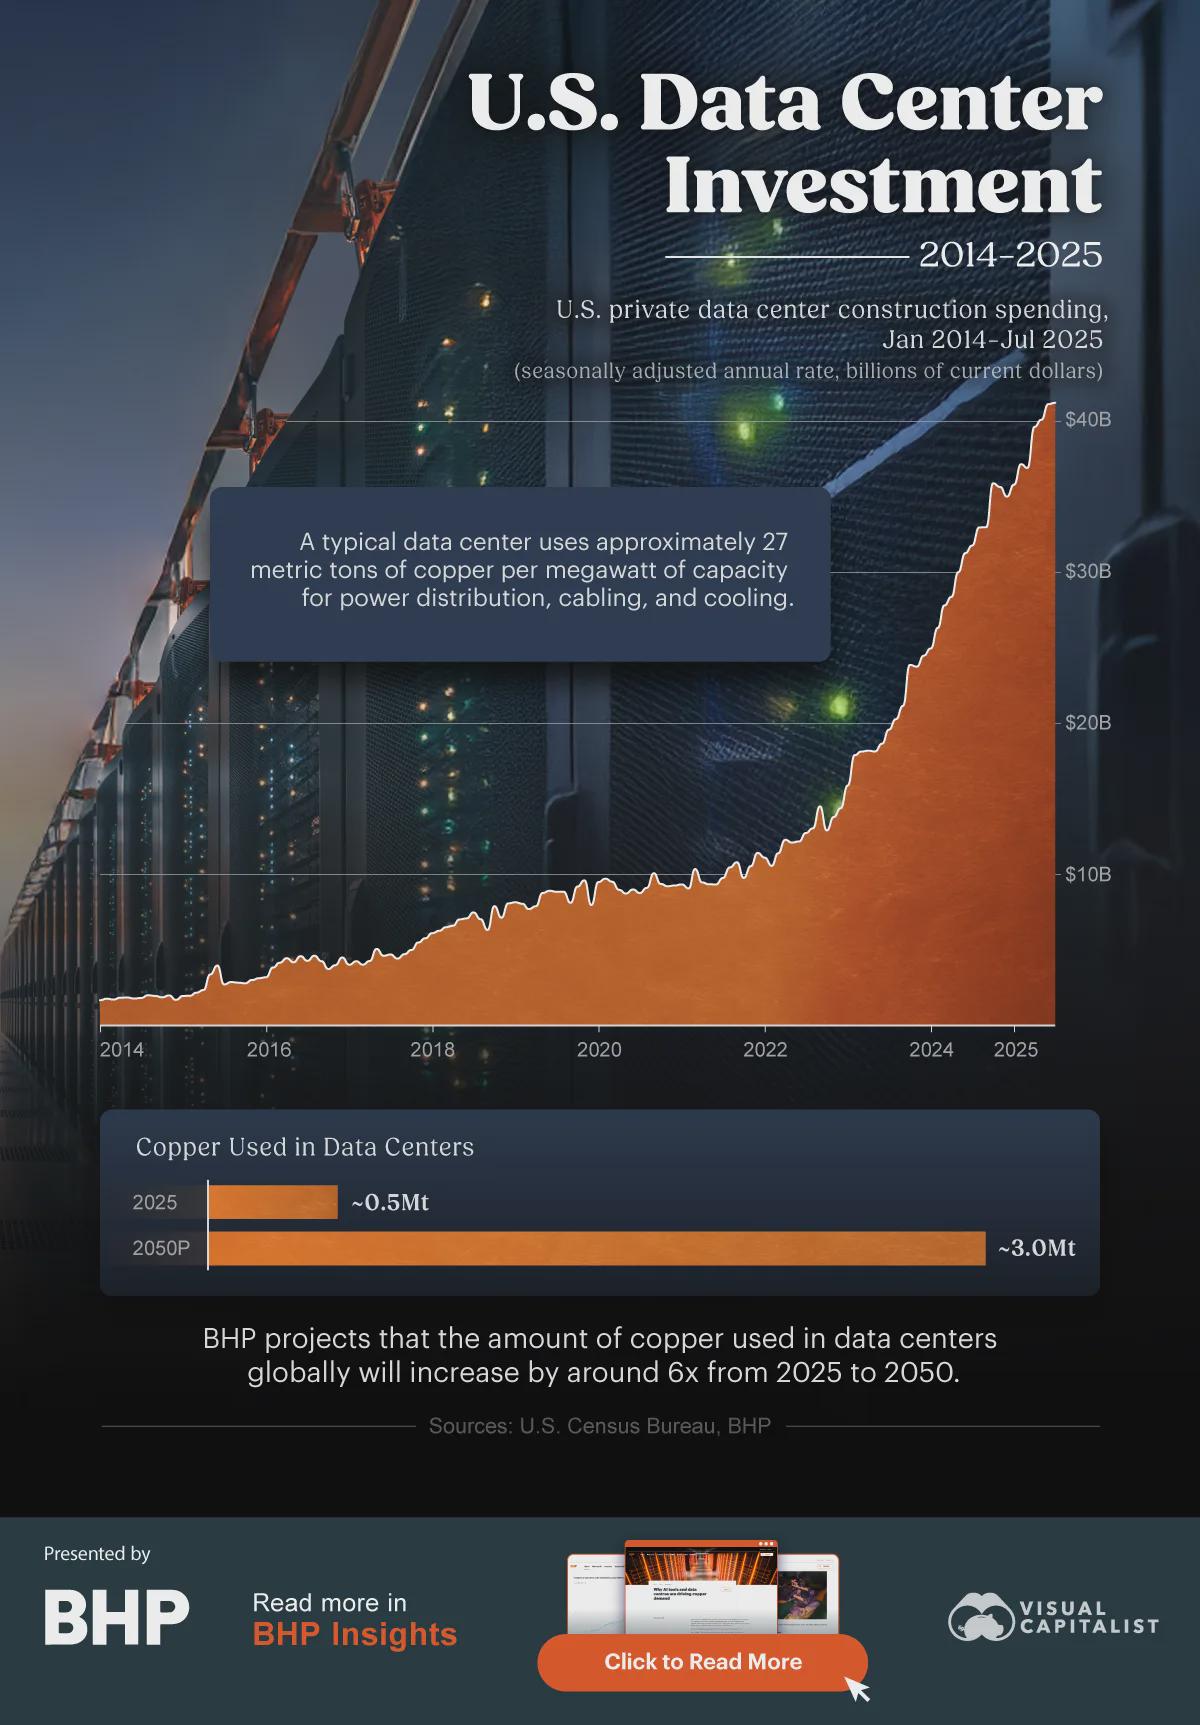
U.S. Data Center Investment Growth (2014–2025) and Its Impact on Copper Demand Statistics
This data visualization displays "U.S. Data Center Investment Growth (2014–2025) and Its Impact on Copper Demand" and pr...
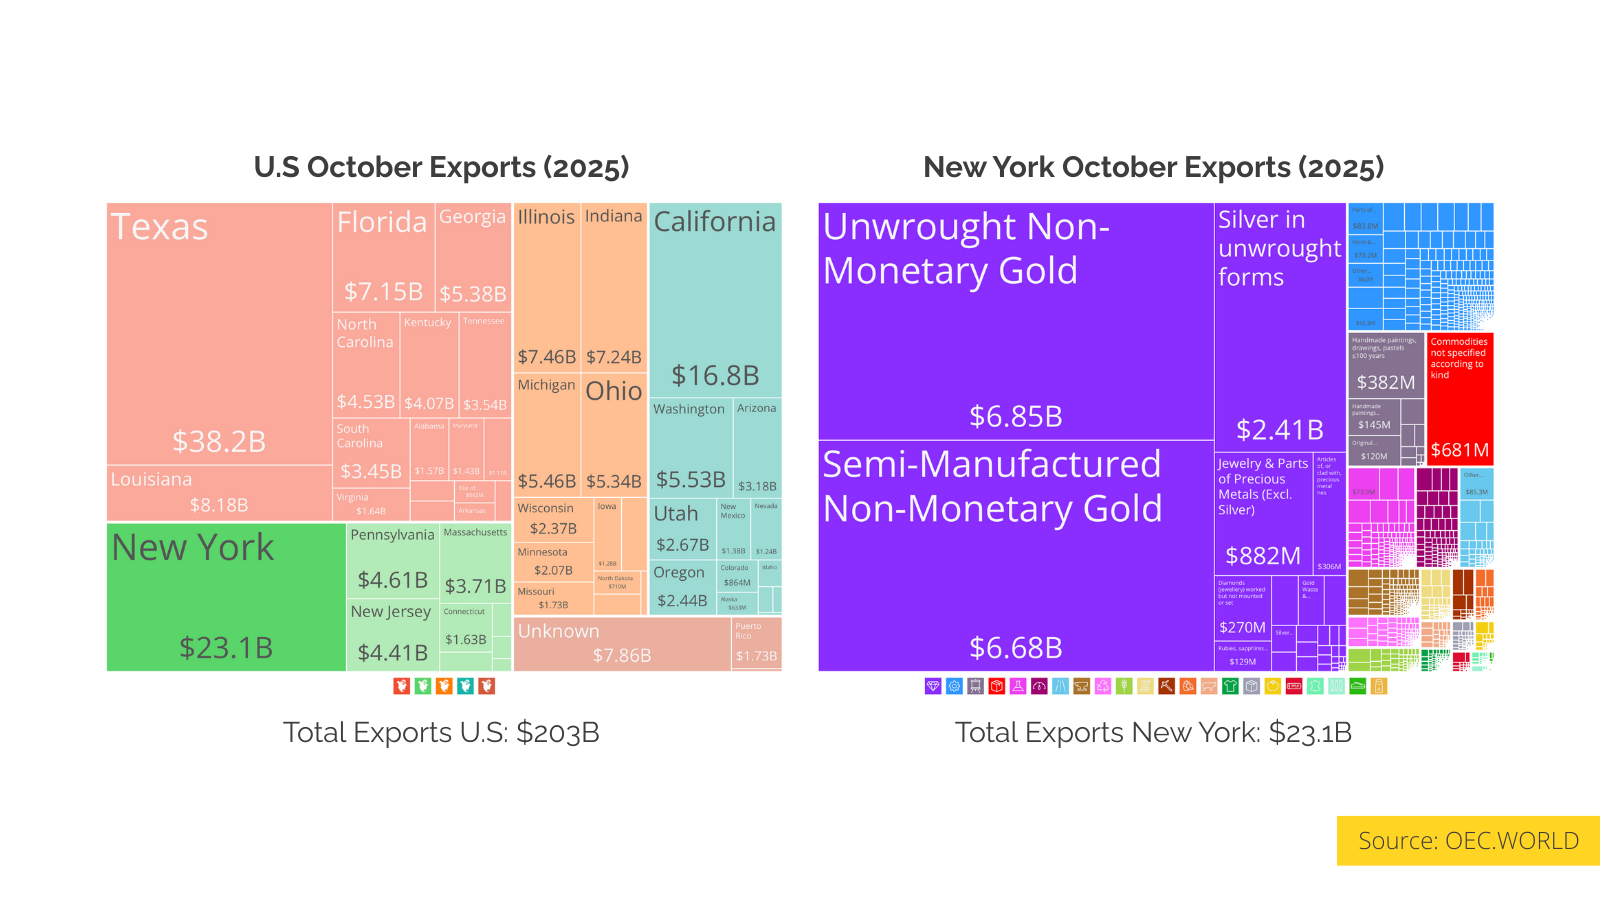
$13.5B in gold left NY, and some of it showed up twice in trade data Statistics
This data visualization displays "$13.5B in gold left NY, and some of it showed up twice in trade data" and provides a c...
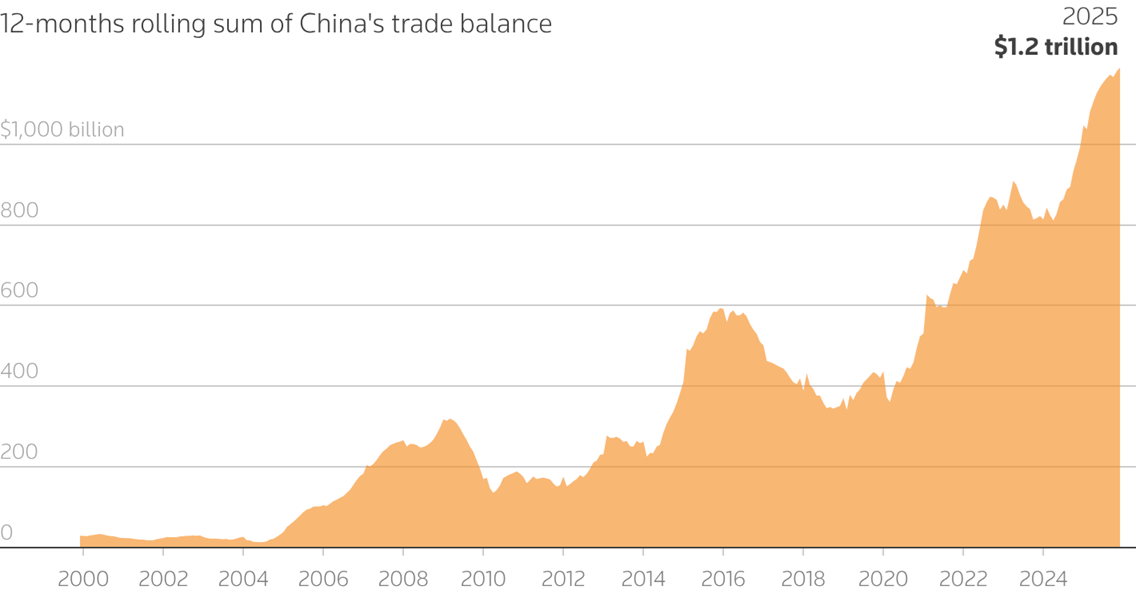
12-month rolling sum of China's trade balance since 2000 (LSEG Datastream/Retuers) Statistics
This data visualization displays "12-month rolling sum of China's trade balance since 2000 (LSEG Datastream/Retuers)" an...
![[OC] U.S. Nonmonetary Gold Exports Quarterly data from 2010 to Q3 2025 (Billions USD, Seasonally Adjusted) Statistics [OC] U.S. Nonmonetary Gold Exports Quarterly data from 2010 to Q3 2025 (Billions USD, Seasonally Adjusted) Statistics](/api/images/reddit-maps/1qqj5bc_1769716803732.jpg)
[OC] U.S. Nonmonetary Gold Exports Quarterly data from 2010 to Q3 2025 (Billions USD, Seasonally Adjusted) Statistics
This data visualization displays "[OC] U.S. Nonmonetary Gold Exports Quarterly data from 2010 to Q3 2025 (Billions USD, ...
![[OC] Data of a bi girl on Hinge over a year Statistics [OC] Data of a bi girl on Hinge over a year Statistics](/api/images/reddit-maps/1qswssg_1769954401070.jpg)
[OC] Data of a bi girl on Hinge over a year Statistics
This data visualization displays "[OC] Data of a bi girl on Hinge over a year" and provides a clear visual representatio...
![[OC] Using a CNN trained on a sports betting dataset, I tried my hand at predicting who will win the Super Bowl. Statistics [OC] Using a CNN trained on a sports betting dataset, I tried my hand at predicting who will win the Super Bowl. Statistics](/api/images/reddit-maps/1qnymxf_1769486402844.jpg)
[OC] Using a CNN trained on a sports betting dataset, I tried my hand at predicting who will win the Super Bowl. Statistics
This data visualization displays "[OC] Using a CNN trained on a sports betting dataset, I tried my hand at predicting wh...
![[OC] Prediction MArkets Data Scraped and Summarized by LLM in Newspaper UI Statistics [OC] Prediction MArkets Data Scraped and Summarized by LLM in Newspaper UI Statistics](/api/images/reddit-maps/1ql3q6d_1769220002423.jpg)
[OC] Prediction MArkets Data Scraped and Summarized by LLM in Newspaper UI Statistics
This data visualization displays "[OC] Prediction MArkets Data Scraped and Summarized by LLM in Newspaper UI" and provid...
![Data Dump?...or Dump Data [OC] Statistics Data Dump?...or Dump Data [OC] Statistics](/api/images/reddit-maps/1qjiht9_1769054401053.jpg)
Data Dump?...or Dump Data [OC] Statistics
This data visualization displays "Data Dump?...or Dump Data [OC]" and provides a clear visual representation of the unde...
![[OC] Time to Unrecoverable Ecological Collapse Data Sources: Phillips et al. (Natural History Museum BIl Dataset) | Kozicka et al. (GLOBIOM-IIASA Livestock Production) Statistics [OC] Time to Unrecoverable Ecological Collapse Data Sources: Phillips et al. (Natural History Museum BIl Dataset) | Kozicka et al. (GLOBIOM-IIASA Livestock Production) Statistics](/api/images/reddit-maps/1qgghe7_1768766401176.jpg)
[OC] Time to Unrecoverable Ecological Collapse Data Sources: Phillips et al. (Natural History Museum BIl Dataset) | Kozicka et al. (GLOBIOM-IIASA Livestock Production) Statistics
This data visualization displays "[OC] Time to Unrecoverable Ecological Collapse Data Sources: Phillips et al. (Natural ...
![Pakistan’s population density mapped as a 3D topography (2023 Census Data) [OC] Pakistan’s population density mapped as a 3D topography (2023 Census Data) [OC]](/api/images/reddit-maps/1qefk6k_1768572001265.jpg)
Pakistan’s population density mapped as a 3D topography (2023 Census Data) [OC]
This data visualization displays "Pakistan’s population density mapped as a 3D topography (2023 Census Data) [OC]" and p...
![Data Manifold of the NYC Housing Market Varying Through Time [OC] Statistics Data Manifold of the NYC Housing Market Varying Through Time [OC] Statistics](/api/images/reddit-maps/1qdte1n_1768521602576.jpg)
Data Manifold of the NYC Housing Market Varying Through Time [OC] Statistics
This data visualization displays "Data Manifold of the NYC Housing Market Varying Through Time [OC]" and provides a clea...