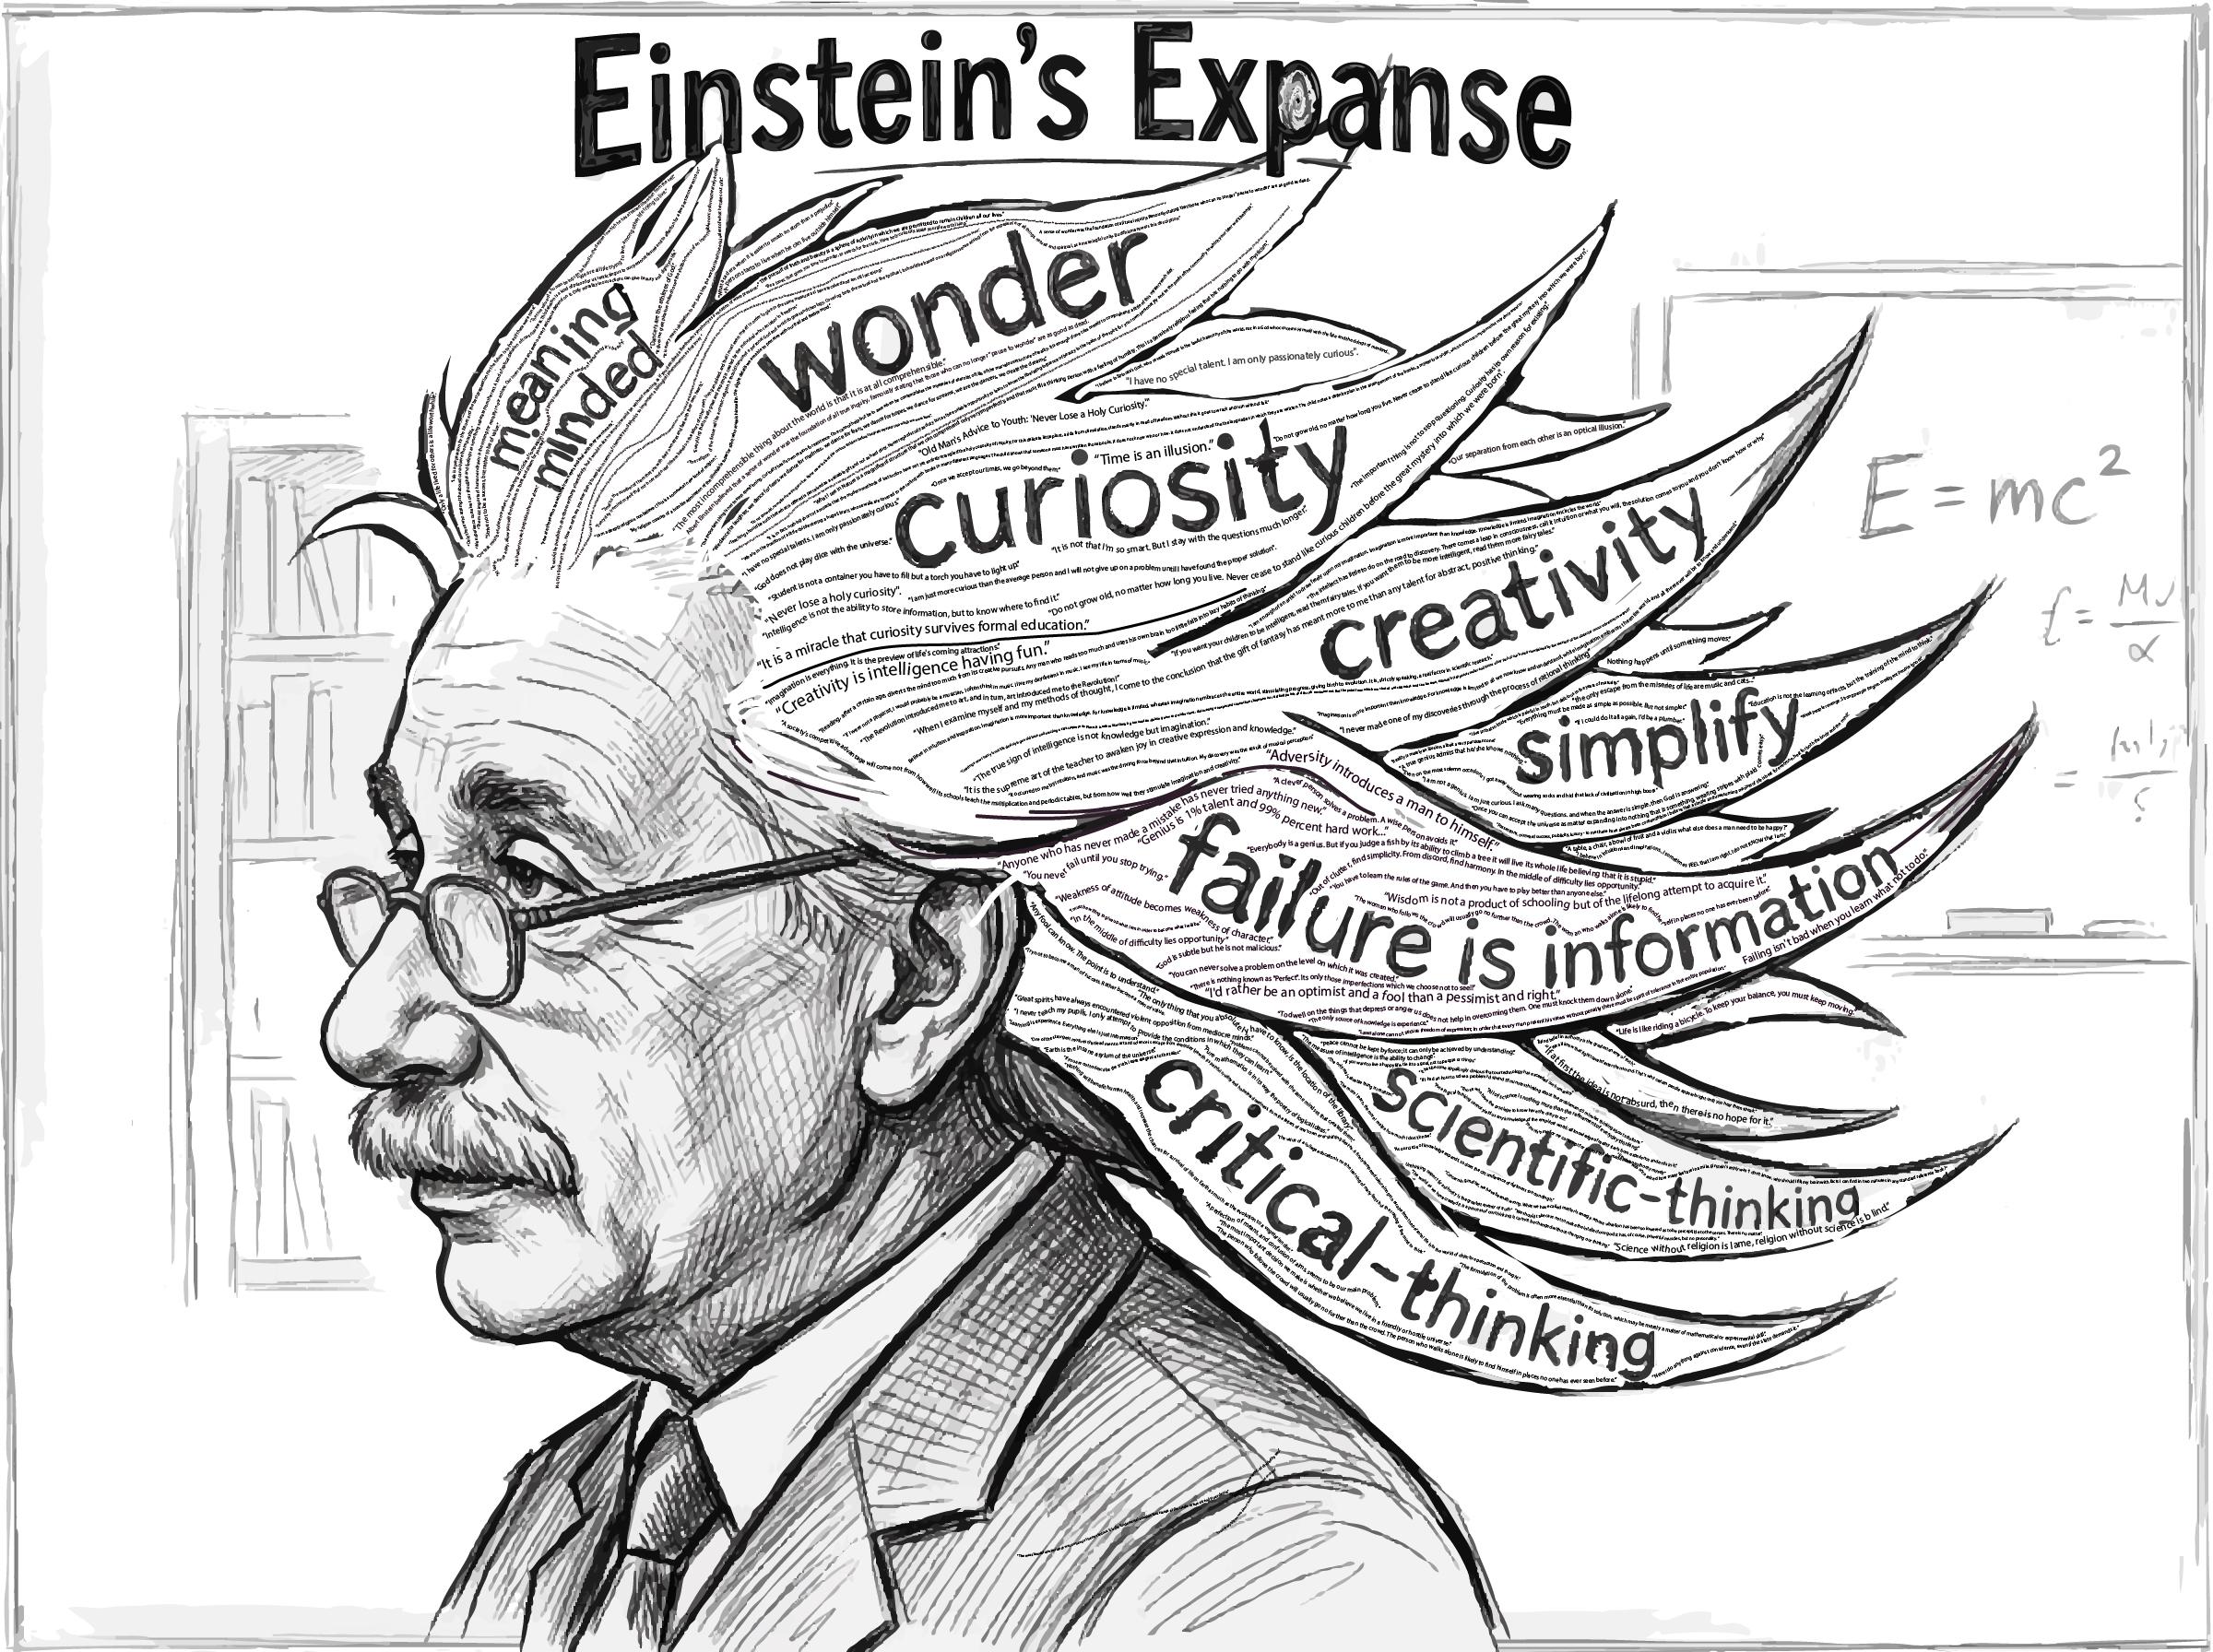
Einstein's Expanse: A collection of quotes from Einstein organized into eight major themes. Visualization
Data Analysis
What This Visualization Shows
This data visualization displays "Einstein's Expanse: A collection of quotes from Einstein organized into eight major themes." and provides a clear visual representation of the underlying data patterns and trends. The visualization focuses on [Higher Resolution PDF:](https://www.dropbox.com/scl/fi/a4m0a2ah3uypgfltsly0v/EinsteinsExpanseeFINALb.pdf?rlkey=697elshodsjy1d83nk0wjbs2u&dl=0)
I decided to title this infographic Einstein’s Expanse.
* I thought it captured the huge range of Einstein’s thinking. * Also, I should be clear that I am no Einstein, but that doesn’t mean I cannot look at him with awe and learn. So, these eight principles are goals to expand my thinking. * I am a fish trying to climb a tree when it comes to Einstein. I do realize this is quote is misattributed but its my username so what are you gonna do :). * I also think using the word expanse is a tip of the hat to Einstein’s work on the expansiveness of the universe.
I think it is fair to group Einstein’s quotes into eight major topics; meaning, wonder, curiosity, creativity, simplify the complex, scientific-thinking and critical-thinking.
1. My first principle of Einstein’s Expanse was that I think he was quite meaning-minded. I think Einstein, especially later in life, was pretty committed to the human condition. His later writings are full of his thoughts on the what it means to be human. Einstein was very meaning-minded 2. Wonder; which is what I would define as the ability to see really large connections. 3. Curiosity is the ability to seek new connections for one’s self. 4. Creativity is the ability to find new meaningful connections that help others find new meaningful connections. Imagine seeing a work of art and it causes a flourish of thoughts. That art caused new connections in you so the artist’s creativity created meaningful connections for you. 5. Einstein, as well as Richard Feynamn, emphasized being able to explain things simply. They proposed that you do not understand something until you can explain it to a 10-year-old or to your mother. As a teacher, that was always my filter, I would imagine my daughters at 10 years old and work to get to a point where I felt I could explain everything in the classroom to my daughters. 6. In a thread similar to Carol Dwecks Mindset, Einstein thought that failure was information. I often state to my students that failure is progress. 7. I will have an infographic on scientific thinking. It is an infographic of Marie Curie, at the lab bench, surrounded by the various principles of scientific thinking. 8. Early in my teaching career, I became concerned that many teachers say they teach critical thinking. But, the actual definition of critical thinking is nebulous. So, I defined it as… 1. Ask a question. 2. Use digital literacy to use good sources. Use authentic scientific studies and not blogs. 3. Socially collaborate because more brains are better than one. 4. Avoid logical fallacies like confirmation bias and strawmen arguments 5. Conceptualize to see the big picture; don’t just memorize facts, see the story even if you have to write it.. 6. Ask a better question and start again.
In the near future, I will create a video of this docugraphic and post it on YouTube.
I will take any input; thank you.
, which allows us to understand complex relationships and insights within the data through visual storytelling.
Deep Dive into the Topic
This data visualization represents a sophisticated analysis of complex information patterns that provide valuable insights into underlying trends and relationships. Data visualization serves as a bridge between raw numerical data and human understanding, transforming abstract statistics into comprehensible visual narratives.
The power of data visualization lies in its ability to reveal patterns, outliers, and correlations that might not be apparent in traditional tabular formats. Through careful selection of chart types, color schemes, and interactive elements, effective visualizations can communicate complex information quickly and accurately to diverse audiences.
Modern data visualization combines statistical analysis with design principles to create compelling visual stories. This interdisciplinary approach requires understanding both the underlying data and the cognitive processes involved in visual perception. The result is more effective communication of quantitative insights that can inform decision-making and drive positive change.
Data Analysis and Insights
The patterns revealed in this visualization demonstrate the importance of systematic data analysis in understanding complex phenomena. By examining different data segments, time periods, and categorical breakdowns, we can identify trends that inform strategic planning and decision-making processes.
Statistical analysis of this data reveals variations across different dimensions that provide insights into underlying drivers and relationships. These patterns help identify areas of opportunity, potential risks, and key performance indicators that can guide future actions and resource allocation.
The analytical approach used in this visualization enables comparison across different categories, time periods, or geographic regions, revealing insights that support evidence-based decision-making. This type of analysis is essential for organizations seeking to optimize performance and understand complex market dynamics.
Significance and Applications
This data visualization has important implications for understanding trends and patterns that affect decision-making across multiple sectors. The insights derived from this analysis can inform policy development, business strategy, resource allocation, and operational improvements.
For analysts, researchers, and decision-makers, this type of data visualization provides essential insights for strategic planning and performance optimization. Whether addressing operational challenges, market analysis, or policy development, understanding data patterns helps create more effective strategies and solutions.
The broader significance lies in how this information contributes to our understanding of complex systems and relationships. This knowledge helps predict future trends, identify potential challenges, and develop more informed approaches to problem-solving and opportunity identification.
Comments
Loading comments...
Leave a Comment
About the Author

Alex Cartwright
Senior Data Visualization Expert
Alex Cartwright is a renowned data visualization specialist and infographic designer with over 15 years of experience in...